
(Bloomberg Opinion) -- The big population shifts toward the South and inland West over the past few years have been attributed to many factors, from lower taxes and more permissive pandemic policies to better weather and fear of crime.
There’s surely something to all of these explanations, but they only take you so far. The pandemic policy differences have pretty much vanished; violent crime is generally worse in the South than in other parts of the country; the tax advantages to moving across state lines accrue mostly to those with very high incomes, who make up only a small percentage of the movers; and people clearly aren’t being lured from California to Texas by the weather.
Meanwhile, there is another explanation that largely holds up across the board. It’s that local governments in the South and inland West — what the US Census Bureau calls the Mountain division — are building lots of new houses and apartments for people to move into. In April 2020, these regions were home to 45.6% of 331.4 million US residents, a share that had risen to 46.3% by mid-2022. From 2020 through 2022, they accounted for 65.8% of new housing construction.
This imbalance becomes a bit more tangible if you examine housing construction by metropolitan area. Here are the ones where local governments issued permits for the most new housing units over the past three years (the Census Bureau doesn’t track housing starts or completions at the local level, so permit statistics are the best data available).
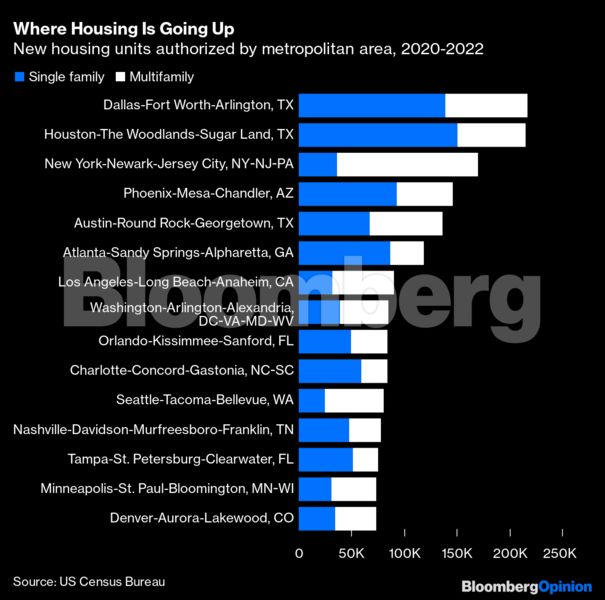
Yes, a few areas outside the South and Mountain West do make the list. New York-Newark-Jersey City is near the top of it. But it is the country’s most populous metropolitan area by far, with more than twice as many inhabitants as metro Dallas and metro Houston combined, and less than half as many new housing units. Metro Los Angeles, with almost six times as many inhabitants as metro Austin, authorized a third fewer housing units.
Some adjustment for population is thus in order. Here are the top 15 large (population of 1 million or more) metro areas for 2020-2022 housing permits relative to their 2020 population. Eleven are in the South and three in the inland West.
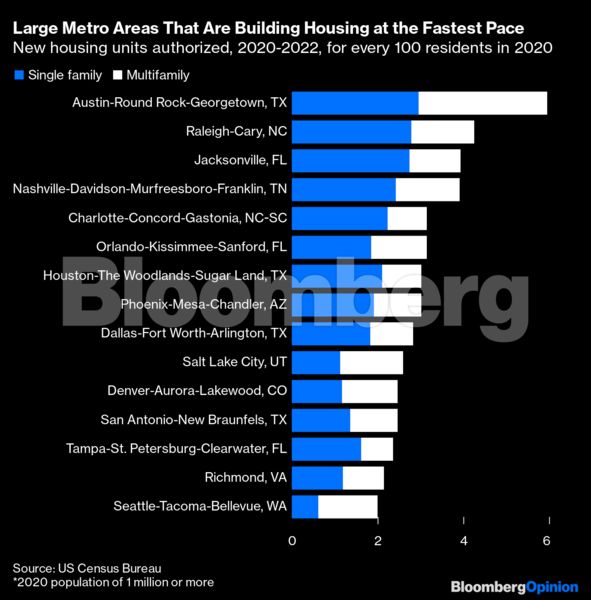
Many of these metro areas are able to build so much more housing in part because they’re surrounded by mostly flat land on which developers can easily plunk down new subdivisions. But that’s not the only thing happening. In greater Seattle, a West Coast metropolis hemmed in by mountains and water that is the geographical anomaly on this list, 69% of the new housing units authorized were in multifamily buildings, almost half of them in Seattle proper. Apartments also made up the majority of new housing permitted in and around Austin, Salt Lake City and Denver, and more than 40% in metro Orlando, San Antonio and Richmond.
Here, by contrast, are the 15 large metro areas with the smallest number of new housing units authorized per 100 inhabitants from 2020 through 2022.
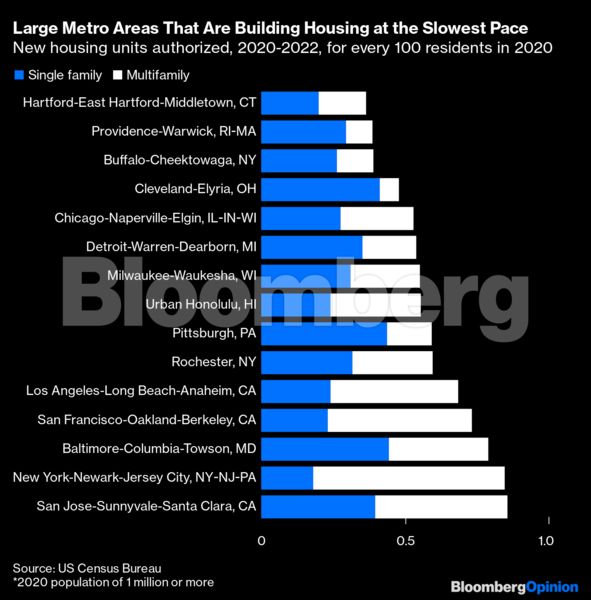
Demand obviously plays a big role here. Among US metropolitan areas of all sizes, the one with the fewest new housing units authorized over the past three years — just 17 single-family houses — is Danville, Illinois, set among the corn and soybean fields on the Indiana border about two hours’ drive south of Chicago. Supply constraints such as Nimbyism, regulation, lack of available land and high construction costs surely aren’t the obstacles in Danville, and they probably aren’t the main things slowing construction in most of the large metro areas on the above list.
In and around Los Angeles, San Francisco, New York and San Jose, the story is different. Sure, there are other aspects of life in all four places that have driven people away over the past few years. But it’s not a coincidence that Los Angeles, San Francisco and San Jose occupy the bottom three spots on the Federal Reserve Bank of Atlanta’s metro area Home Ownership Affordability Monitor, which compares median home prices and other housing costs with local median household incomes, and New York is the sixth least affordable (fourth and fifth places are occupied by two other California metropolitan areas, San Diego-Carlsbad and Oxnard-Thousand Oaks-Ventura). Chronic underproduction of new housing in these areas has pushed up prices to levels that drive people away.
More From Writers at Bloomberg Opinion:
- Can’t Give Up Your Low Mortgage Rate? Renovate!: Alexis Leondis
- Building More Housing Does Make It Cheaper. Really: Justin Fox
- Why Millennials Are Following Boomers to the South: Conor Sen
Want more Bloomberg Opinion? OPIN
To contact the author of this story:
Justin Fox at [email protected]
© 2023 Bloomberg L.P.


