
A lot of the asset and wealth management industry is, understandably, focused these days on imperatives such as scale, digitization, control, fees and asset growth. So it seems a good time to dial up the focus on “V2C,” or value to client. Underinvestment in V2C puts the potential benefits of those other imperatives at risk.
We’ll seek to pick up the V2C beat by building on our earlier piece “A New High Ground for Wealth Advisors and Their Clients.” In that piece, we demonstrated how good wealth advisors smartly allocate investment fees, not just assets, to drive V2C. And we introduced a yardstick—return on fees invested (RFI)—that can help with this.
In this piece, we go further to illustrate how RFI can be used to help wealth advisors and investors sharpen the V2C lens they look through to evaluate and choose from among different investments, thereby moving further onto the high ground of advice we described.
Because our objective here is simply to demonstrate a technique, not recommend investments, we’ll start with the reasonably straightforward asset class of large-cap growth equity mutual funds over the past five years, and we won’t seek to screen for every conceivably important factor. We won’t complicate our analysis for now with other critical elements of valuable advice beyond investment performance, such as financial planning, risk and tax management, and behavioral coaching. We don’t take sides in the running battle between active and passive management, but we found it surprising and enlightening to see what the data tell us about certain funds in this mature asset class whose demise at the hands of index funds seems to be more or less assumed by many.
We began by screening for top U.S. large-cap growth equity funds based on the following criteria:
- Top-rated (Morningstar 5-star) in the “large growth” category of funds on a trailing three- and five-year basis
- Institutional share class (where investors can expect little or no sales loads to purchase)
- Five-year Sharpe ratio (risk-adjusted return) greater than 1.0
We winnowed the resulting list further to have just one fund per fund family (the one with the best-appearing statistics) and limit ourselves to funds with readily available statistical comparisons to the Russell 1000 Growth Index as a benchmark. We did this to enable apples-to-apples comparisons as much as possible and because there is a low-cost (0.08% annual expense ratio) Russell 1000 Growth ETF (ticker VONG) that advisors and investors can turn to if they want large-cap growth equity exposure but none of the mutual funds turn out to add any meaningful V2C versus a low-cost, accessible index.
Here are some of the revealing stats we found or calculated from Morningstar on the group of 10 funds we found:
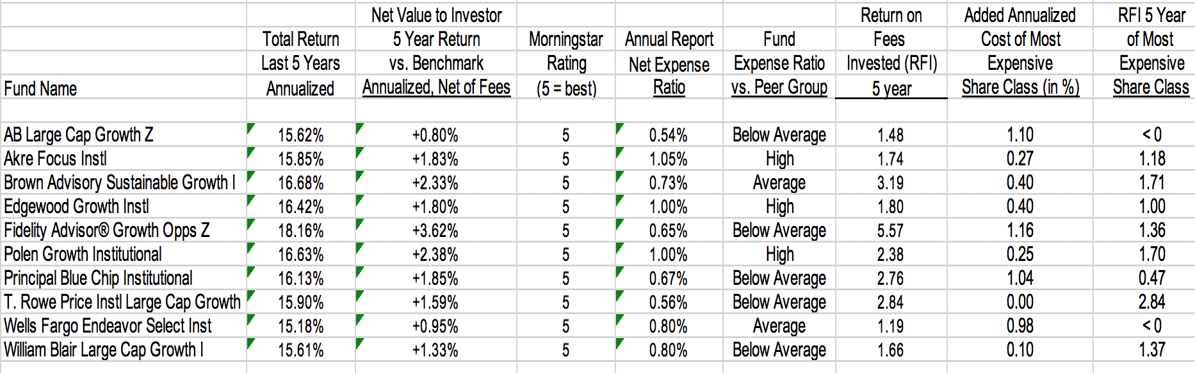
What are the data telling us?
- All the funds have produced annualized returns in excess of their benchmark (Russell 1000 Growth Index), net of fees, over the past five years.
- The expense ratios on these funds range rather widely, from 0.54% to 1.05% annually.
- The characterization of the funds’ expense ratios by Morningstar ranges from “below average” to “high.”
Now let’s see how RFI can help bring V2C into sharper focus for advisors and investors who might be trying to choose from among these investments.
At first blush, an advisor or investor might be tempted by a 5-star fund with a “below average” expense ratio. In this group, the AB Large Cap Growth Fund fits that bill and has the lowest expense ratio at 0.54%. But what a more discerning investor might see in the RFI is that there are other funds on this list that appear to demonstrate an even more favorable benefit-to-cost ratio, or V2C.
The AB Large Cap Growth Fund has a five-year RFI of 1.48, indicating that investors in that fund have received $1.48 of value, net of expenses, for every dollar of expense that this fund incurs. But by contrast, the Fidelity Advisor Growth Opportunities Fund shows an RFI of 5.57, indicating $5.57 of value to the investor, beyond the benchmark index and net of expenses, for every dollar of expense incurred. Both funds are considered to have a “below average” expense ratio.
Perhaps even more striking is that all of the funds described as having “high” expense ratios—which might trigger an initial “avoid at all costs” reaction—actually have better RFIs than the AB fund, indicating that they have delivered a better benefit-to-cost proposition (V2C) over the past five years.
Discerning advisors and investors would not stop there. They’d also look at the RFI for the particular share class of the fund in which they were contemplating an investment. The costs and minimum investments required in these different share classes can vary widely and have a big impact on the RFI and therefore on V2C. As you can see in the last column where we’ve calculated the RFI for the highest-cost share class for each fund, the benefit-to-cost proposition revealed by the RFI has a big impact on the indicated desirability of the investment:
From winners to “sinners.” Two of the funds go from being contributors to V2C (RFI > 0) to detractors (RFI< 0).
Air pockets. For example, the RFI of the Fidelity fund goes from 5.57 (Investor receives $5.57 of net value for every dollar of expense) to 1.36 (investor gets $1.36 of net value for every dollar of expense) in the most expensive share class.
From “sinners” to winners. Once we adjust for the additional cost of the most expensive share class, some of the funds with “below average” expense ratios are surpassed significantly in RFI (and V2C) by funds categorized as having “high” or “average” expense ratios.
Takeaways for Boosting V2C
V2C measures, such as return on fees invested (RFI), provide a stronger lens to help advisors and investors be more discerning in their evaluation of fees, investments, and advice giving and taking. Rather than overrelying on categorical broad brushes that miss big differences in benefit-to-cost propositions, adding this fairly simple calculation to your decision-making mix can put you in a better position to be a good advisor and investor. Furthermore, making sure that V2C measures such as RFI are a prominent part of KPI’s (key performance indicators) at asset and wealth management firms is an essential step in improving V2C outcomes and fully capitalizing on a firm’s parallel initiatives to drive scale, asset growth, control, fees and productivity.
Stephen Bodurtha is the founder and CEO of Flexbridge Partners LLC. This article is dedicated with thanks and admiration to the memory of Steve Wunsch, an independent thinker and pioneer who gave the author his first commercial opportunity to explore the costs of trading and investing.


