
Let me start with the reality that the FOMC minutes for the March meeting didn’t do much to stir the markets. Based on the various economic reviews of those minutes, this was the appropriate response: we didn’t learn a lot that we hadn’t heard before in various forms of Fedspeak. Which doesn’t mean those minutes were irrelevant, but they certainly reinforced notions about policy in the months ahead, and that’s what I’m going to tackle today.
Let me get the rate hiking part out of the way first. The minutes did keep the Fed’s assumption of three hikes by year’s end in play, although the market continues to disagree with that assumption. Some of the skepticism is based on economic data (auto sales is the most recent example, the divergence between sentiment and "real" data is another). But some is tied to the interplay between straightforward rate hikes and the reduction in the Fed’s balance sheet.
This interplay is, of course, a huge uncertainty. And it’s that uncertainty which makes this hiking cycle different from all other hiking cycles.
In all other hiking cycles the Fed raised the Funds Rate and left the rest of the curve to fend for itself. The result was predictable: a “bear flattening” to the inflection point where the curve started to look like it would invert, which turned the bear flattening into a bullish event for the long end and ultimately presaged a recession. Life was simpler then.
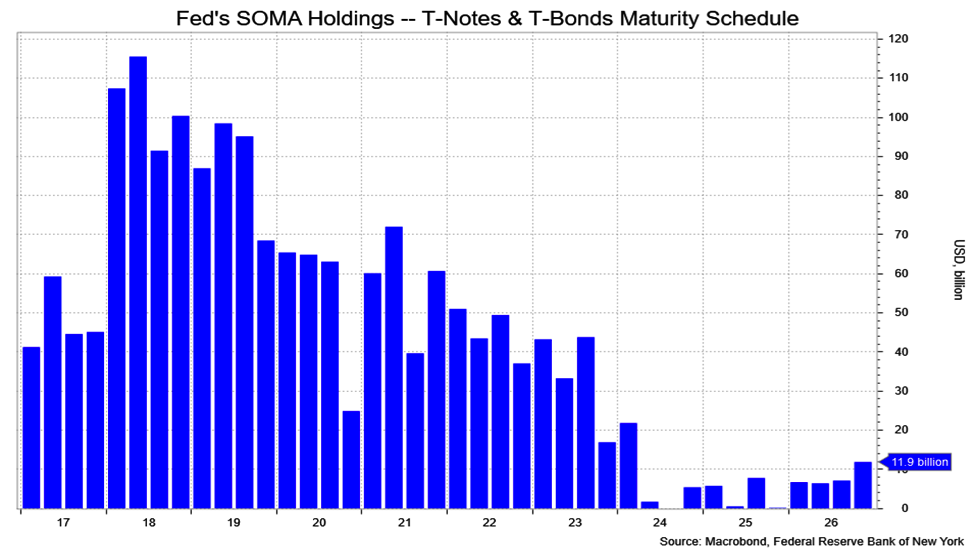
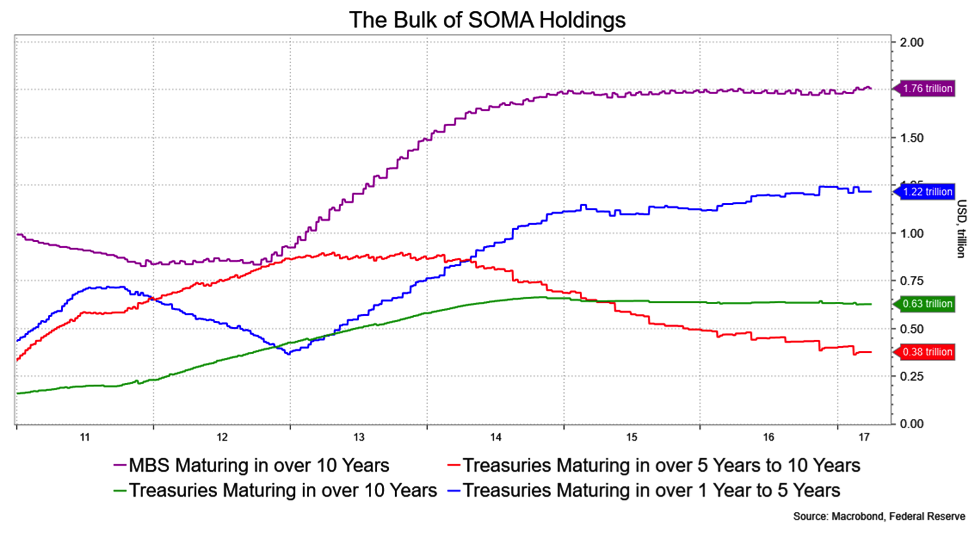
Now we have a challenge to that pattern and the behavior that goes with it. While the Fed has gingerly started to hike the Funds Rate, it has created an uncertain challenge to both ends of the yield curve by bringing its swollen balance sheet into the mix. Simply put, any reduction in reinvesting the cash flow from the holdings on the Fed’s balance sheet means the market will have to buy that incremental amount. This will be more of an issue for the long end of the curve. Of the $4.2 trillion on the Fed’s balance sheet, $2.4 billion of it has a maturity of 10 years or more. So, any reduction likely entails added supply out the curve and some yield premium to accommodate it.
This will happen at a time when the Federal Budget is going to expand anyway, which translates to more coupon issuance. At the end of 1Q17, the Congressional Budget Office updated its long-term budget outlook adding $633 billion to the deficit into 2026 as a result of “the budgetary laws enacted by 114th Congress”. That outlook doesn’t (and can’t) anticipate any additions to the deficit from lower taxes under the Trump administration or more fiscal spending. Nor does that outlook anticipate any recession which would have a deleterious impact on the budget.
Can we find ourselves in a tightening cycle that creates a steeper yield curve? It’s very possible. Consider that in a recent Bloomberg interview New York Fed President Bill Dudley said, “If and when we decide to normalize the balance sheet, we might actually decide at the same time to take a little pause in terms of raising interest rates.”
Given the already slow pace of rate hikes expected (by the market) during this particular cycle, any slowing is a big deal and, relatively speaking, would allow the front end of the curve to outperform the back end. Needless to say, the timing and magnitude of all this will prove the determining factors in the curve behavior.
I have four nearish-term scenarios in mind;
- The Fed hikes more or less on schedule (meaning the market’s schedule) and announces a tapering in the reinvestment program. I’d expect a formal announcement in Q4 with ample Fedspeak alerting the market about it well beforehand. In this scenario the immediate curve impact should be neutral, but market gets put on notice and so will keep an anxious steepening element out the curve. I’d wager 75 percent odds in favor of this.
- The Fed chooses to stop reinvesting immediately, again making a Q4 announcement for 2018 implementation, which is bearish for the back end (and MBS), but offers some consolation to the front about gradualism. In other words, the hint is that they err on a slower pace of hikes. This is a curve steepener, but with low odds, maybe 15 percent.
- They sell securities. I would say not in my lifetime, but perhaps not in the lifetime of my career, which hopefully is rather shorter than the former. Again, the Fed’s selling would coincide with the overall rising deficit and any resulting rise in long-term interest rates presumably be felt hard by the economy. I just don’t see this happening for years and give it a 5 percent.
- They do nothing or actually add to the balance sheet. Having opened up the Pandora’s Box of the balance sheet in the last recession, it’s now become a tool for the next one. I’d give these low odds — I only have 5 percent left to play with — though I do think a recession is a reasonable bet before the next presidential election if only due to the longevity of the current expansion.
Among the imponderables we face is the makeup of the Fed, about which there’s no value in second guessing. Will they be businessmen who favor easy money i.e., like the "Free Silver" populists of another era, or the anti-Yellens of Trump’s campaign rhetoric? The best I can offer is that this shuffling of the deckchairs adds an extra dose of volatility to mix.
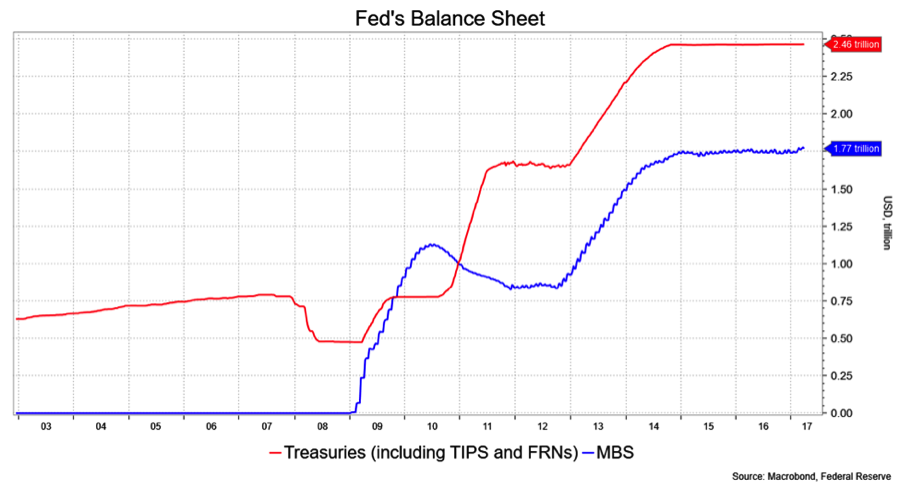
A second imponderable is how big the Fed wants its balance sheet to be. If the Fed merely stopped reinvesting the balance sheet, back-of-the-envelope calculations suggest would shrink by about $1.5 trillion inside of five years — and presumably more with MBS refinancings — or roughly 40 percent of their existing portfolio. In other words, the Fed could run down the balance sheet without selling a thing. So, how big do they want it to be? In 2008, it was a mere $490 billion versus today’s $4.2 trillion. Some guidance here would be useful, but the Fed probably has no more clue than you or me.
There was one more thing in the minutes that probably got ignored but is worth noting. Under the heading of “Staff Review [of] the Financial Situation”, the authors mentioned that, “broad equity price indexes rose further, leaving some standard measures of valuations above historical norms” and “some measures of valuations, such as price-to-earnings ratios, rose further above historical norms.”
Later in the section under the “Participants’ Views” (meaning the FOMC members), they said, “Some participants viewed equity prices as quite high relative to standard valuation measures.”
I’ve been writing for a while about the Fed’s sensitivity to high asset valuations, going back two years to Janet Yellen’s warning that stock valuations were rich. There’s not much more to say other than the Fed is watching this metric and, merely by observing above-norm valuations, is letting the market know that it’s a concern which, on the margin, provides more reason to tighten than might otherwise be the case. The thing is, the spot on the curve where such an effort would have the biggest impact for such valuations is not at the Fed Funds end. In the event, I’d look for allocations from equities to the mid to longer end of the yield curve.
David Ader is Chief Macro Strategist for Informa Financial Intelligence.


