
The financial media tends to focus much of its attention on market forecasts by so-called gurus. They do so because they know it gets the investment public’s attention. Investors must believe they have value or they wouldn’t tune in.
Yet, a large body of evidence demonstrates that market forecasts from gurus have no value in terms of adding alpha (though they provide me with plenty of fodder for my articles)—the accuracy of ‘expert’ forecasts is no better than one would randomly expect. For investors who haven’t learned that such prognostications should only be considered entertainment, or what Jane Bryant Quinn called “investment porn,” they, in fact, have negative value because they can tempt investors to stray from well-developed plans. This danger is especially acute when forecasts confirm the investor’s own views, subjecting them to confirmation bias.
Despite the evidence, many investors rely on market experts and forecasters when making investment decisions. To determine if that is wise, we’ll review the empirical findings from two studies on the accuracy of guru forecasts.
The CXO Advisory Group set out to determine if stock market ‘experts,’ whether self-proclaimed or endorsed by others, reliably provide useful stock market timing guidance. To find the answer, from 2005 through 2012, they collected and investigated 6,584 forecasts for the U.S. stock market offered publicly by 68 experts: bulls and bears employing technical, fundamental and sentiment indicators. They selected experts, based on web searches of public archives, with enough forecasts spanning enough market conditions to gauge accuracy. They found:
Across all forecasts, accuracy was worse than the flip of a coin—on average, just under 47%.
The distribution of forecasting accuracy by the gurus looked very much like the bell curve—what you would expect from random outcomes.
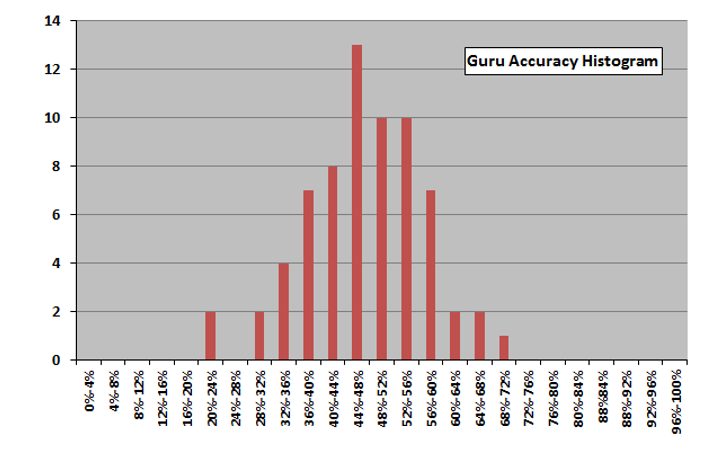
The highest accuracy score was 68% and the lowest was 22%.
There were many well-known forecasters among the “contestants.” Here are five of the more famous, each of whom makes regular appearances on CNBC, along with their forecasting score:
- Jeremy Grantham, Chairman of GMO LLC, a global investment management firm, 48%;
- Dr. Mark Faber, publisher of The Gloom, Boom and Doom Report, 47%;
- Jim Cramer, CNBC superstar, 47%;
- Gary Shilling, Forbes columnist and founder of A. Gary Shilling & Co. Inc., 38%; and
- Abby Joseph Cohen, former chief U.S. investment strategist at Goldman Sachs, 35%.
Only five of the 68 had scores above 60% (among them was David Dreman, with a score of 64%), and 12 had scores below 40%. Also noteworthy is that strategies based on forecasts may have no costs but implementing them certainly does.
David Bailey, Jonathan Borwein, Amir Salehipour and Marcos López de Prado found similar evidence in their study Do Financial Gurus Produce Reliable Forecasts? Their focus was on forecasts made for the S&P 500 Index. They found:
- Only 48% of all forecasts were correct;
- 66% of the forecasters had accuracy scores of less than 50%—worse than randomly expected;
- 40% of forecasters had accuracy scores of 40%-50%; 19% had scores of 30%-40%; 4% had scores of 20%-30%; and 3% had scores of 10%-20%; and
- 18% of forecasters had scores of 50%-60%; 10% had scores of 60%-70%; and 6% had scores of 70%-80%.
Among the notables with poor accuracy scores were Jeremy Grantham, 41%; Marc Faber, 39%; Jim Cramer, 37%; Abby Joseph Cohen and Gary Shilling, 34%; and Robert Prechter (famous for the Elliott Wave Theory), 17% (the worst score). Among the notables with the best scores were David Dreman, 70%; Louis Navellier, 66%; Laszlo Birinyi, 64%; and Bob Doll, 60%. The best score was John Buckingham’s 79%.
The Value of Survey Forecasts
While the evidence demonstrates that acting on the forecasts of market gurus is not likely profitable, perhaps survey forecasts (the collective wisdom of crowds) do add value.
Songrun He, Jiaen Li, and Guofu Zhou, authors of the March 2023 study How Accurate Are Survey Forecasts on the Market?, sought to answer that question. They examined three sets of survey forecasts on the market return:
- The Livingston Survey (LIV), a biannual survey (June and December every year) about the U.S. economy—the S&P Index in particular—conducted by the Federal Reserve Bank of Philadelphia. The respondents are drawn from practitioners and economists (professional forecasters) from industry and academic institutions. About 90 participants are on the mailing list, of which 55 to 65 respond to the survey each time.
- The CFO Survey, a quarterly survey of U.S. financial professionals about the financial outlook of their firms, sampling approximately 4,500 CFOs of which about 400 respond. The data prior to April 2020 can be accessed at Duke’s Fuqua School of Business, and after that at the Federal Reserve Bank of Richmond.
- The Nagel and Xu (NX) survey, which consolidates various data sources, including the UBS/Gallup survey, the Conference Board survey and the University of Michigan Surveys of Consumers, to form a representative survey of a typical U.S. household.
Here is the summary of their key findings:
None of the survey forecasts beat a simple random walk forecast that predicted the future returns by using their past sample mean. For a mean-variance investor who allocated between the market and risk-free asset with a typical risk aversion of 3, the investor would have been substantially worse off (losing 1% to 18% per year) switching from a random walk belief to using one of the survey forecasts.
While both professionals and individuals failed to outperform the naive prediction of the historical average, the professional forecaster survey expectations produced even worse results (R-squared ranging from -51.69% to -12.47%) than individual investors (R-squared = -0.42%). The CFO survey expectations produced better predictability, R-squared = 2.36% (1.27% using the median expectation). However, the positive results were statistically insignificant.
If surveys failed to add value in predicting the markets, He, Li and Zhou questioned if another candidate could. They examined whether the short interest index, which is an aggregated short interest of all short sellers in the market, would consistently beat the random walk, and if it could perform better than pooling 14 commonly used macroeconomic variables. (The data on short interest is available here.) They found that the short interest index performed best, with an out-of-sample R-squared ranging from 6.4% to 16.63% (versus 4.66% for the macroeconomic variables).
Not Even the Fed Knows What Will Happen
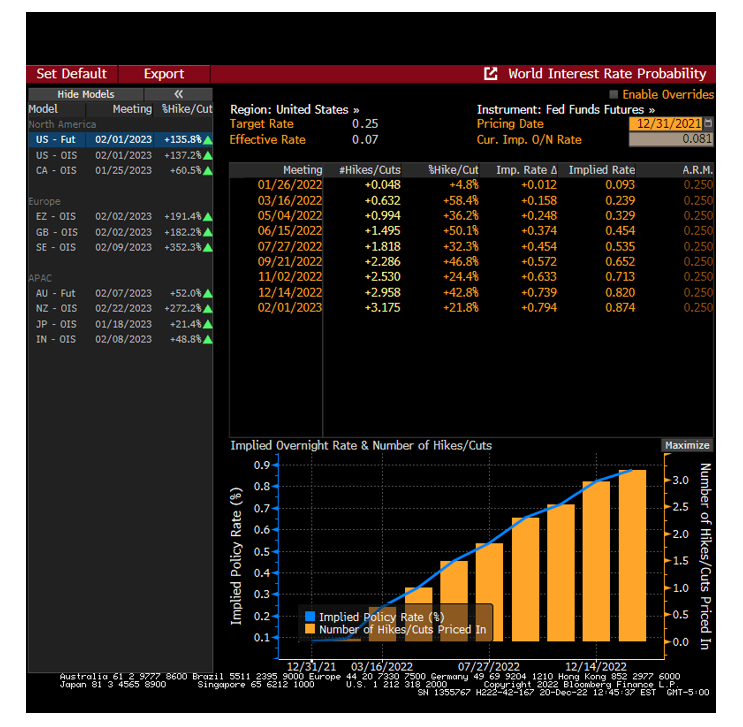
Here’s an illustrative example of the difficulty of adding value through forecasting the economy and markets. One would assume that if anyone could accurately predict the path of short-term interest rates, it would be the Federal Reserve—not only are they professional economists with access to a tremendous amount of economic data, but they set the Fed funds rate. The chart below shows the Federal Reserve’s forecast of the number of interest rate increases it would implement in 2022 and the implied forward rates. It demonstrates that the Fed believed they would increase rates just three times and that their policy rate would end the year below 1%.
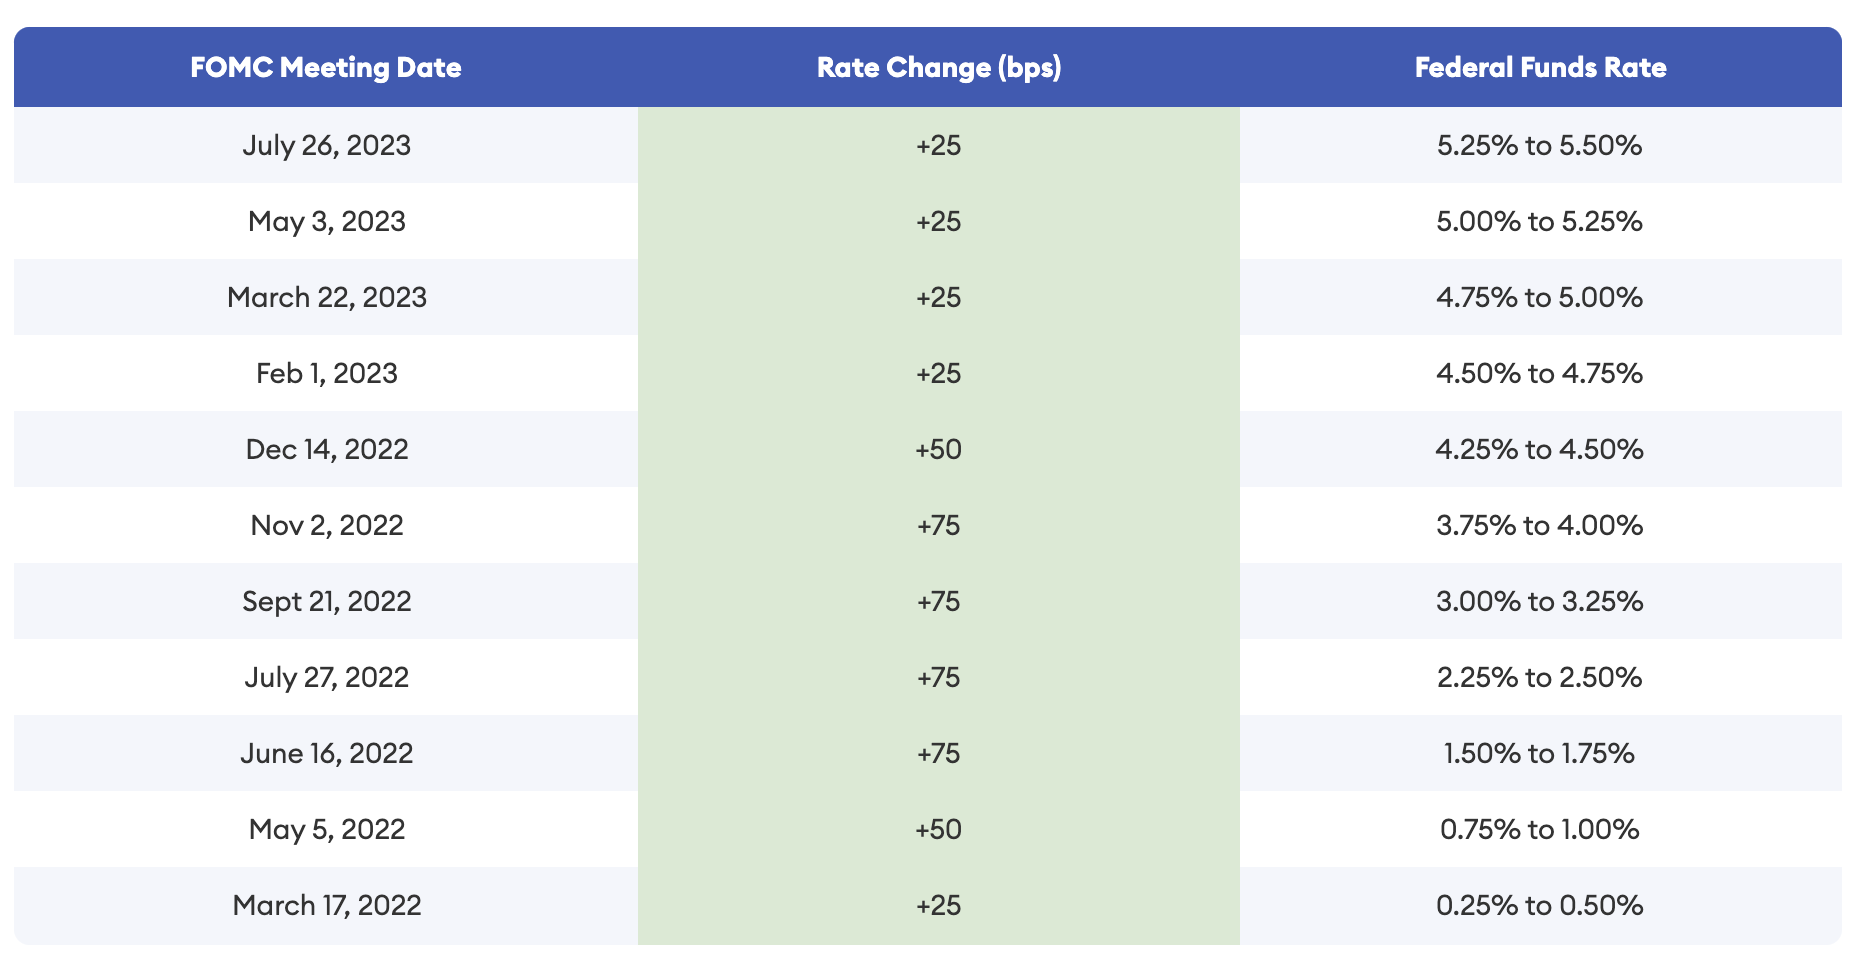
Yet, as the table below shows, the Federal Reserve raised the Fed funds rate seven times in 2022, ending the year with the target rate at 4.25%-4.50%. If the Federal Reserve, which sets the Fed funds rate, can be so wrong in its forecast, it isn’t likely that professional forecasters will be accurate in theirs.
Market movements are often dominated by surprises, which by definition are unforecastable. One of the surprises, at least to the Fed, was that inflation turned out to be much higher than its forecast. Its December 2021 forecast for 2022 inflation was for the core CPI to be between 2.5% and 3.0%. Inflation turned out to be more than double that.
Investor Takeaways
One of the most interesting, and surprising, results is that despite their greater financial literacy, the professional forecasters produced significantly worse forecasts than the average household. The takeaway is that market forecasts should be ignored, regardless of whom they come from—professional economists or market gurus. Instead, investors are best served by having a well-thought-out plan, including rebalancing targets, and sticking to that plan. That’s the warning Warren Buffet offered in his 2013 letter to Berkshire shareholders: “Forming macro opinions or listening to the macro or market predictions of others is a waste of time. Indeed, it is dangerous, because it may blur your vision of the facts that are truly important.”
Larry Swedroe has authored or co-authored 18 books on investing. His latest is Your Essential Guide to Sustainable Investing. All opinions expressed are solely his opinions and do not reflect the opinions of Buckingham Strategic Wealth or its affiliates. This information is provided for general information purposes only and should not be construed as financial, tax or legal advice.


