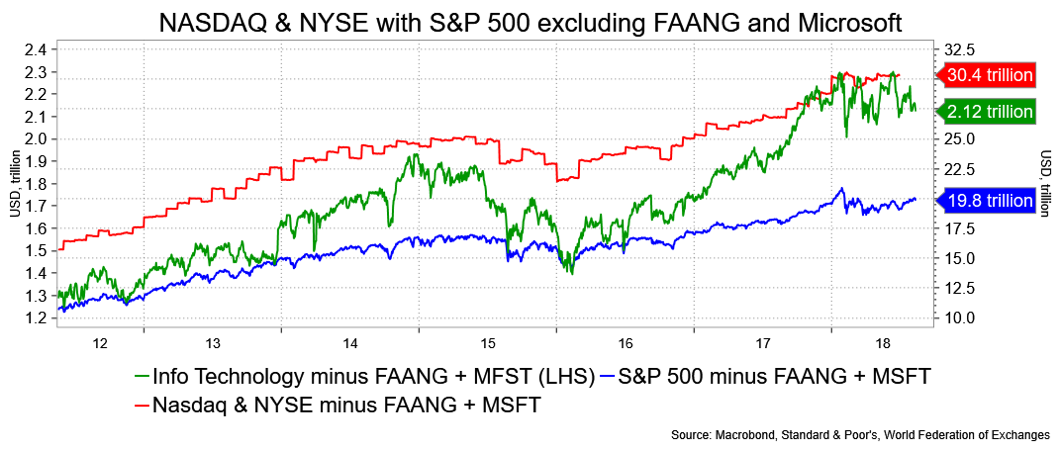
Here are the stock indicators with the most enviable track records—and the cautionary tale that they tell.
The most bearish of them “projects” a negative 3.9 percent annualized return under inflation and the most bullish just 3.6 percent over inflation. That bullish one is 300 basis points below the real return for the last, oh, 200 years.
The correlations with the stock market are rather compelling. I am allowing that the multitude of charts and perhaps the somewhat arcane nature of them are overwhelming—perhaps moving into the realm of nerdom. But when putting them together they do contribute to one’s angst over the pace of the equity market and, my goal, to offer more reason to expect the bond market to find support on relatively shallow pullbacks.

David Ader is Chief Macro Strategist for Informa Financial Intelligence.


