
According to Vanguard research, the average defined contribution retirement plan offers 18 investment options. Among those plan participants presented with sector fund choices, Vanguard found that technology is selected most often as a portfolio enhancement.
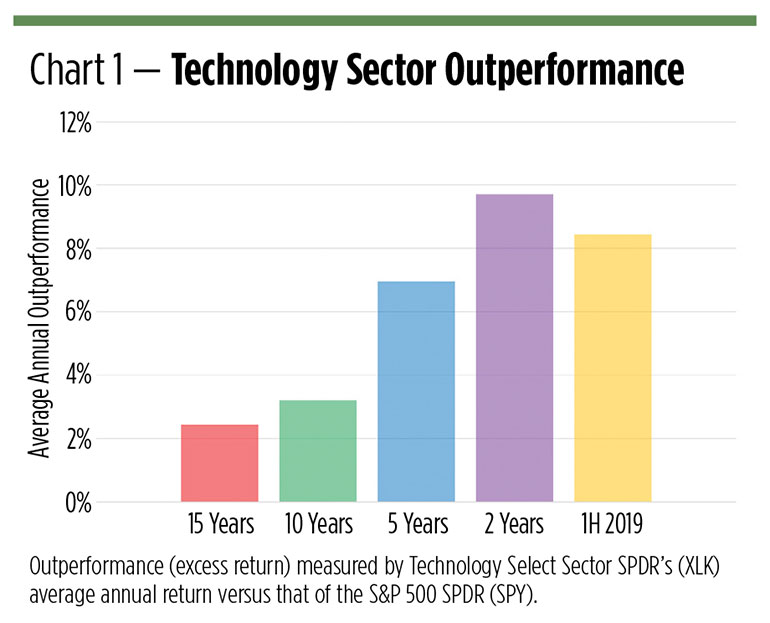
It’s easy to see why. Tech has outshined the broad market in every discrete period over the past 15 years (see Chart 1), so why not attempt to boost portfolio returns with an overweight bias toward the sector?
But is tech the only sector worth a tilt? Are there other sectors that have fared well? Are there market segments that have yielded more alpha than technology? With, perhaps, less risk?
By poring over the track records of sector index ETFs, namely those from the Select Sector SPDR family, when benchmarked against the S&P 500 SPDR (NYSE Arca: SPY), a broad market proxy, the answer to those questions is: yes.
Sector Returns
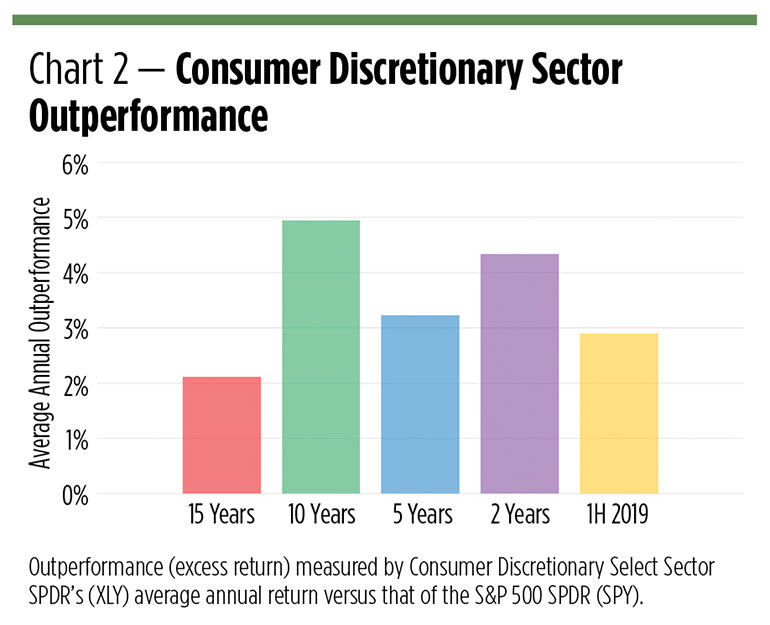
The Technology Select Sector SPDR (XLK) isn’t the only sector fund to consistently outperform SPY over our five distinct time periods. The Consumer Discretionary Select Sector SPDR (XLY) did so as well, though not quite to XLK’s degree. XLK’s return outdoes SPY’s by an average of 6.51%—sort of an average of averages—over all the intervals. XLY beats SPY by 3.51%.
Tech doesn’t necessarily beat all other comers in every time span, though. Over 10 years, for example, XLY’s average annual outperformance is actually 1.74 percentage points better than XLK’s. If you look back 10 years and find an environment similar to the one you envisage for the next decade, XLY’s track record may give you comfort in favoring that sector as an overweight.
And the other sector ETFs? All—and by implication, the sectors themselves—exhibited mixed results versus the general market. Four of the remaining seven sector ETFs produced excess returns in at least one discrete period. The Industrial Select Sector SPDR (XLI) outgunned the S&P proxy over the 15-year and 10-year cycles, as well as in the first half of 2019. There are two spans—15 years and 10 years—in which the Health Care Select Sector SPDR (XLV) outperformed ,while the Consumer Staples Select Sector SPDR (XLP) and the Utilities Select Sector SPDR (XLU) each overtook SPY for the 15-year period.
Sector Volatility
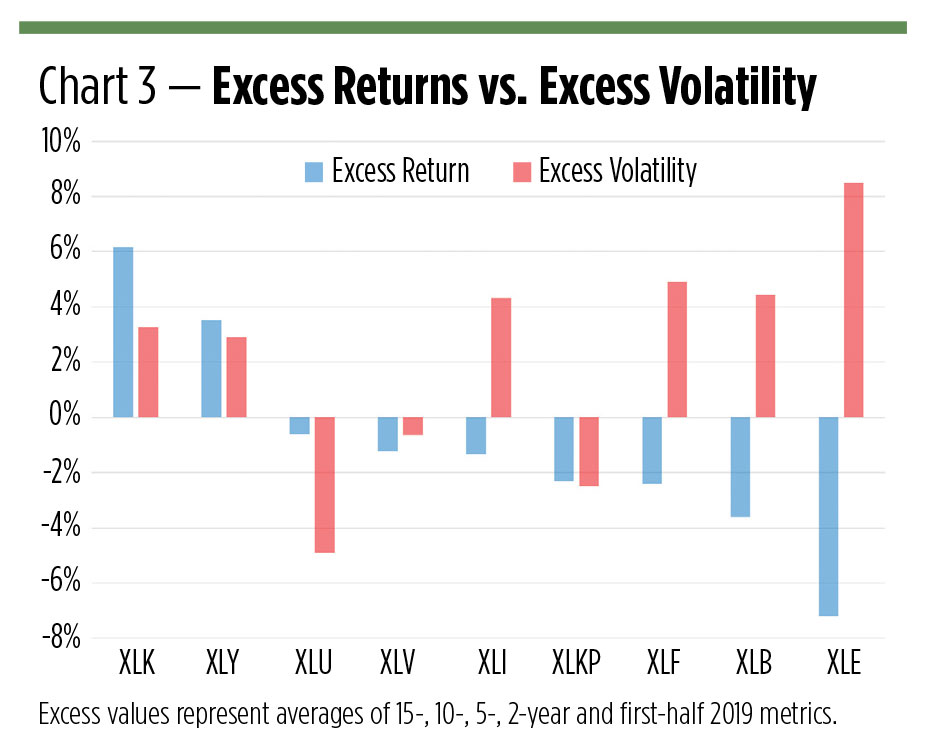
It’s fine to consider a sector overweight on the basis of excess return, but the potential for excess volatility should also be considered. After all, one often leads to the other. In fact, two-thirds of the sector ETFs cranked out higher volatilities than the benchmark.
Ideally, you’d want above-benchmark returns with below-benchmark volatility, but, as you can see from Chart 3, that ideal wasn’t realized in our sector ETF universe. There are plenty of opportunities to earn subpar returns with superordinate volatility, but not the other way around. Our outperforming sectors come with high relative volatility scores alongside their outsize returns.
You can get a more holistic perspective on the interplay of returns and volatility through each sector fund’s alpha coefficient.
Sector Alpha and R-squared
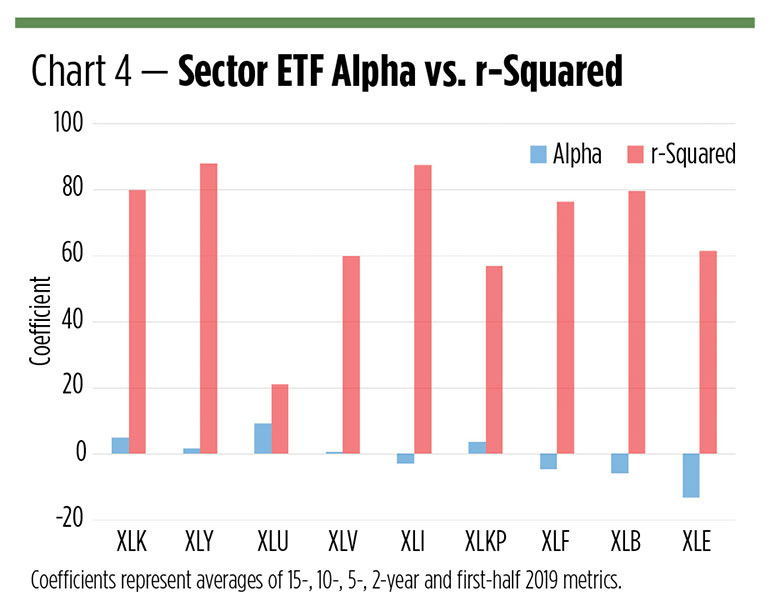
Alpha measures an investment’s return in excess of its beta-adjusted benchmark. By holding beta in check, the coefficient affords an apples-to-apples comparison of each sector fund’s performance against SPY’s. Five of the sector ETFs produced positive alpha, raising hopes for each as a candidate to overweight in a portfolio.
What’s bound to be surprising to many observers is the top alpha cranker. It isn’t technology; it’s utilities—with a 9.30 average annualized reading. Think of it this way: If SPY were as volatile as XLU, the utilities fund would have outperformed it by more than 9% each year.
The XLK technology sector fund comes in second with a 5.08 alpha coefficient, followed by the 3.60 reading generated by the XLP consumer staples ETF.
It’s important to remember that these are averages of the alpha coefficients produced over five time spans ranging from six months to 15 years. Hidden within them are some revealing trends. Most notably, XLU’s alpha reading shot up in the first half of 2019, along with that of XLP. Utilities and consumer staples are traditional defensive havens for equity investors. Going in the opposite direction are the worsening alpha trends of the Energy Select Sector SPDR (XLE) and for the Financial Select Sector SPDR (XLF).
Alpha may point out overweight candidates, but a final decision needs to take diversification into account. Put simply, the model overweight should provide a little “zag” for the broad market’s “zig.” The r-squared coefficient can give you a quick sense of each fund’s potential for distinction.
Technically, r-squared measures the degree to which a fund’s performance can be explained by the market. A Morningstar-like reading near 100 (statistically, 1.00) implies greater predictability, while r-squared values near zero indicate looser connections.
Two ETFs stand out for their high (> 80) r-squared factors: the Industrial Select Sector SPDR (XLI) and the XLY consumer discretionary fund. At the extreme opposite end of the spectrum is the XLU utilities portfolio with its 21.03 coefficient.
Putting It All Together
Vanguard’s research reveals that the average defined contribution plan participant employs three investment options at a time, an approach that readily accommodates an overweight strategy. A reasonable model starts with a traditional balanced (“60/40”) portfolio from which a 10% carve-out from the equity side is made to make room for additional sector exposure. The 60/40 portfolio serves as a benchmark to determine the efficacy of each overweight option and is memorialized in the gray row at the top of Table 1. The portfolio’s alpha and r-squared coefficients, as well as its information ratio, versus a 100% exposure to SPY (the red row at the bottom of the table), is shown alongside the portfolio’s return, volatility and maximum drawdown.
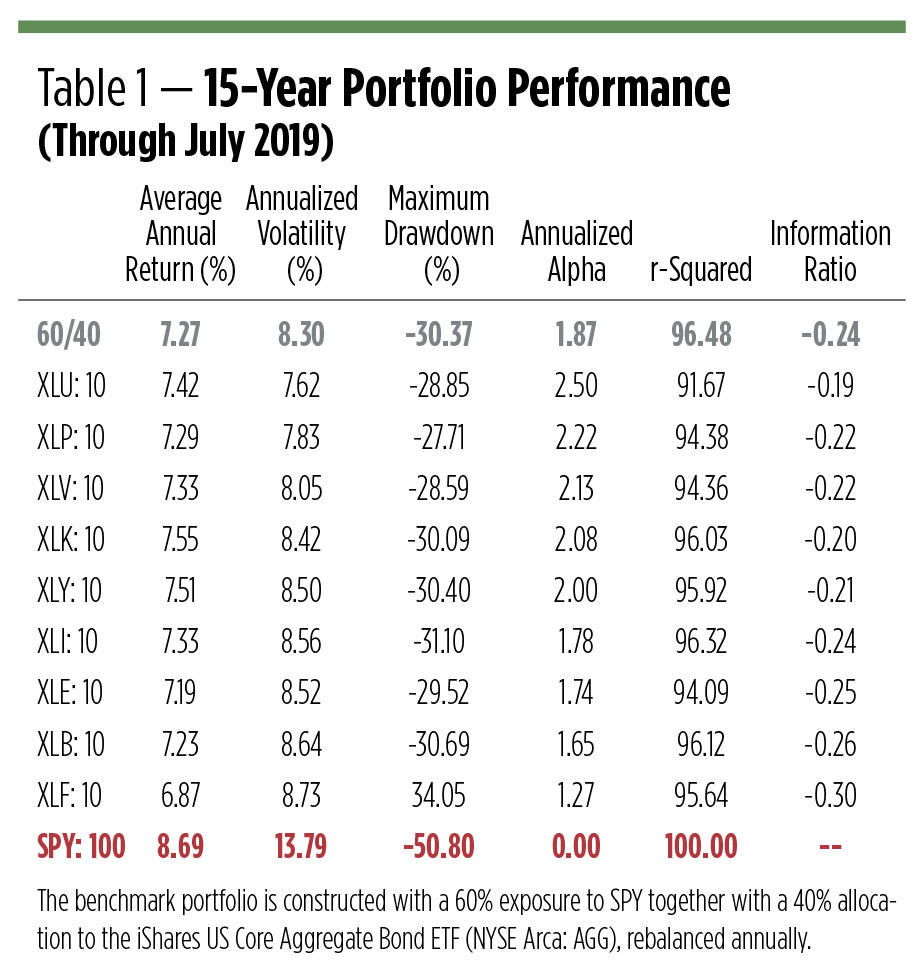
You’ll note how adding bond exposure to SPY (see the note below the table) creates alpha by tamping down SPY’s volatility. This comes at a price. The average annual return of the balanced portfolio is lower than SPY alone, but the balanced portfolio shaved more than 20 percentage points off its drawdown exposure.
Each “50/40/10” overweight portfolio is ranked in the table on the basis of its alpha versus a SPY position. By this measure, the utilities overweight is the optimal portfolio. XLU’s stand-alone return may have underperformed SPY, but the sector fund’s high alpha and low r-squared characteristics overcome this deficit. The XLU carve-out actually boosts portfolio returns. In the end, the XLU-weighted portfolio generates the third-highest average annual gain among the nine asset mixes. It wins (more) by not losing (much).
Technology, the “go to” overweight for many investors and advisors, does enhance the return of a balanced portfolio (at an average annual gain of 7.55%, it’s the best return of all), but its high volatility and correlation to SPY act as drags. A portfolio tilted toward tech earns a fourth-place finish in the alpha derby.
It’s important to note the efficacy of the other portfolio overweights. Upping a portfolio’s sector exposure can enhance alpha, but not universally. You’ll note in Table 1 how just five overweights resulted in alpha enhancement over the benchmark portfolio.
So, is the 2.50 alpha coefficient earned by the utility-tilted portfolio a good score? It’s certainly better than a zero. Could it be higher? Perhaps so. Alpha’s been hard to find while the broad stock market has been in a post-recession run-up. The aging beta bull will eventually be put down, and when it is, alpha may be easier to acquire.
The portfolios in the table, remember, are built with index ETFs. There’s no active risk within the component funds. Whether defined contribution plan participants can attain these results depends entirely upon the investment options offered. Actively managed funds can produce disparate outcomes.
Keep in mind, too, that these are long-term results. Some of the statistics are subject to averaging over 15 years. Returns, alpha and other metrics can look decidedly different in shorter time frames. And of course, the future is not the past, and these sectors may not exhibit similar characteristics over the next 15 years. Nonetheless, the past is all we have to go on, and it suggests that an overweight tilt to some chosen sectors over a longer time frame is likely to pay off—at least a bit.