

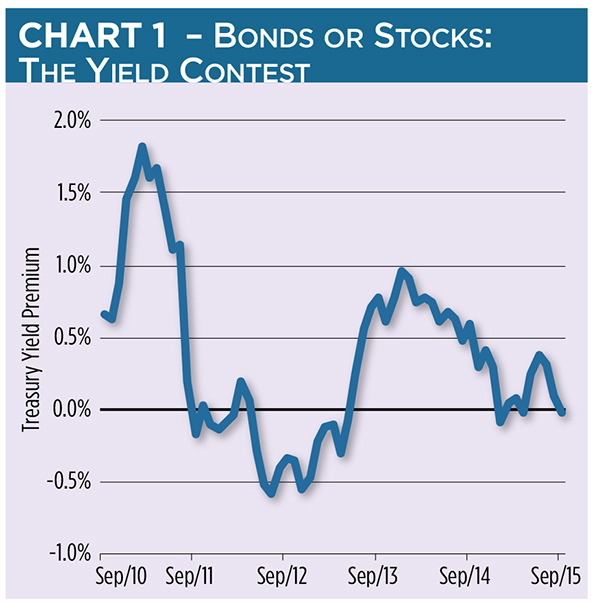
In today’s low-yield bond market, it’s no wonder income-oriented investors have looked to dividends for supplemental cash flows. In February 2011, ten-year Treasury notes were paying nearly two percentage points more than the S&P 500 dividend yield (see Chart 1). The yield premium has since plummeted and, at times, actually turned into a discount.
Blue Chips Stalled
The ten-year and blue-chip benchmarks are now pretty much stalled at a two percent yield, forcing many investors to cast about for better-paying opportunities. Especially enticing are high-dividend exchange-traded funds (“ETFs”), which offer cash flows nominally devoid of duration and interest rate risk. Seven have track records stretching back more than five years:
- The 100 stocks making up the iShares Dow Jones Select Dividend ETF (NYSE Arca: DVY) are screened on the basis of dividend growth and sustainability. Utilities account for more than a third of the portfolio’s capitalization. Financials, mostly REITs, come in second.
- The 50-stock SPDR S&P Dividend ETF (NYSE Arca: SDY), which screens the S&P 1500 Composite Index for stocks with 20 years or more of consecutive dividend increases, maintains a narrower portfolio. Consequently, SDY skews heavily toward REITs.
- Vanguard avoids REITs entirely in its high-dividend product. The 400+ stocks populating the Vanguard High Dividend Yield ETF (NYSE Arca: VYM) are more or less evenly weighted by sectors and tilt toward large caps.
- First Trust sponsors two veteran high-dividend ETFs. The larger, First Trust Value Line Dividend ETF (NYSE Arca: FVD), is built with low-beta issues found with Value Line’s proprietary “safety rating” methodology. Not surprisingly, FVD gives over nearly a quarter of its real estate to utilities.
- The loose inclusion criteria of the WisdomTree High Dividend ETF (NYSE Arca: DHS) accounts for its 900+ stock portfolio and its relatively modest sector bets. Still, financials are weighted more heavily than utilities.
- FVD’s stablemate, the First Trust Morningstar Dividend Leaders ETF (NYSE Arca: FDL), is a 100-stock portfolio comprised of companies that have boosted their dividends over the past five years. REITs are specifically excluded. Accordingly, FDL tilts toward utilities.
- Rounding out the set is the PowerShares High Yield Equity Dividend Achievers (NYSE Arca: PEY), a 50-stock portfolio of large caps selected on the basis of their ten-year dividend growth histories. Utilities figure heavily in the mix—more so, in fact, than in the other veteran funds.
When interest rates sag, income-hungry investors may be tempted to chuck fixed-income exposure in favor of high-dividend funds. That’s a very risky move, however. Remember: These funds are equity products. Replacing all or part of a portfolio’s fixed-income allocation increases exposure to stock market volatility and can further concentrate risk in certain industry sectors.
Choices, choices
So how do you squeeze some extra yield out of the market without blowing your risk budget? The first step ought to be identifying the high-dividend funds that provide the greatest diversification. There’s a couple of ways to look at this problem.
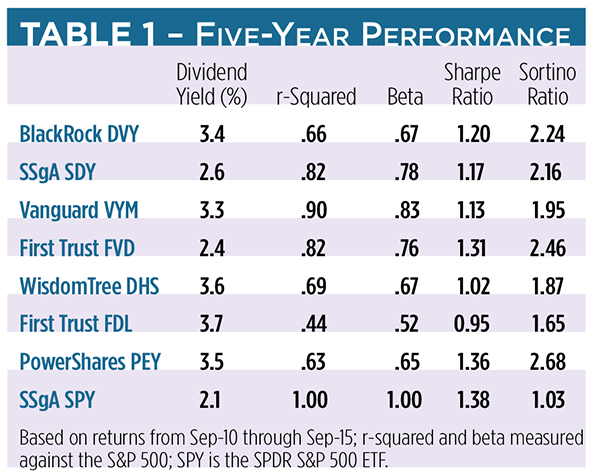
From Table 1, you can see that the First Trust FDL portfolio, in addition to offering the highest dividend yield, has the lowest r-squared and beta correlations versus the S&P 500. That makes FDL pretty different and pretty attractive. FDL, however, posts the worst Sharpe and Sortino ratios of the lot. Not a good thing.
The Sharpe metric, remember, rates a fund’s risk-adjusted returns using total volatility. The Sortino ratio does the same thing but only uses downside deviation as the representation of risk.
If preservation of capital is paramount, a high-dividend fund sporting the best Sharpe and Sortino ratios ought to be a top pick. That makes the PowerShares PEY fund a standout.
The next problem is the allocation issue. Just how much of the high-dividend fund do you add to your portfolio? And, where do you carve out room for it? Here, a little backtesting offers clues.
Suppose you’re keen on dampening risk as much as possible while keeping your commitment to a high-dividend product at 20 percent of your capital. Let’s look back at the last five years to see how PEY might have performed.

Classic 60/40 Portfolio
Our benchmark will be a classic “60/40” portfolio: 60 percent stocks, represented by the SPDR S&P 500 ETF (NYSE Arca: SPY), and 40 percent bonds, proxied by the iShares Core Aggregate Bond ETF (NYSE Arca: AGG).
Taking a 20 percent PEY carve-out from the bond side (a “60/20/20” allocation) produces a significantly higher average annual return than the benchmark but yields an inferior Sortino ratio.
Splitting the PEY carve-out equally from the equity and bond sides (a “48/32/20” mix) improves both nominal and risk-adjusted returns but ticks up volatility.
The sweet spot’s found by carving out a PEY allocation from the classic portfolio’s equity side (a “40/40/20” exposure). There’s a minimal impact on the portfolio’s average annual return but a significant reduction in volatility and, therefore, realized risk. Both risk ratios, especially the Sortino metric, are dramatically improved at the cost of just 10 basis points in annualized returns.

High div/low vol packages
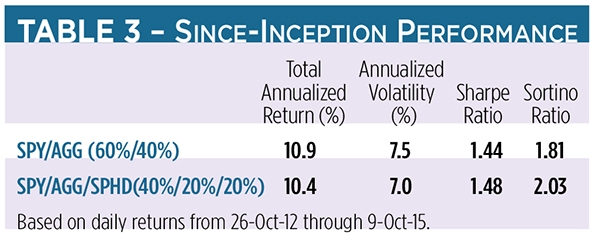
Some newer high-dividend ETFs attempt to entice risk-averse investors by branding themselves as “low-volatility” portfolios. The oldest of these, launched in 2012, is the PowerShares S&P 500 High Dividend Low Volatility ETF (NYSE Arca: SPHD). SPHD’s index methodology screens the S&P 500 for 50 of the blue-chip benchmark’s highest-paying and least-volatile components, tilting the portfolio heavily toward utilities, consumer staples and financials. At last look, SPHD paid out a 3.5 percent dividend.
It’s no surprise that SPHD is highly correlated to its parent index. Movements in the S&P 500 explain 77 percent of SPHD’s variance. SPHD’s beta, at .76, makes the fund a middling competitor to the veteran high-dividend products.
Using SPHD in a “40/40/20” portfolio pares 50 basis points off the return earned by a classic “60/40” portfolio and an equal amount from the portfolio’s volatility. The significant improvement in the portfolio’s Sortino ratio bespeaks SPHD’s defensive sector concentration.
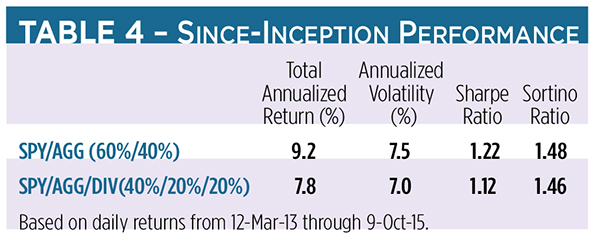
SPHD isn’t the only ETF claiming low-vol street cred. The Global X SuperDividend US ETF (NYSE Arca: DIV) is another 50-stock portfolio that screens stocks for low volatility, but its universe includes MLPs and REITs. Thus, the fund’s high-dividend yield is north of seven percent.
The fund’s equal-weighting scheme magnifies the energy and financial sectors’ influence, which perhaps explains why a portfolio including DIV has Sharpe and Sortino ratios worse than a classic “60/40” mix.
As with anything, it pays to look beyond the advertising for real evidence. Volatility is relative.
Investors will soon have another exchange-traded high-div/low-vol option. Legg Mason recently filed a registration statement for an ETF based on the QS Low Volatility High Dividend Index, a proprietary benchmark that culls 3,000 domestic stocks for sustainable dividends as well as low earnings and price volatility. The Legg Mason Low Volatility High Dividend ETF is expected to be listed on Nasdaq, but no ticker symbol has yet been assigned.
What’s clear from this exercise is that dividends come at a cost. Each high-dividend fund is constructed differently, and each presents a unique combination of risks and rewards. The highest-yielding product may not be the best addition to your portfolio. It’s often better to accept a more modest cash flow than risk hard-earned capital.


