
In my last piece, I focused on the sensitivity of indexed universal life (IUL) and promised to expand on it in this piece. How does a minuscule spread in return over time take a hypothetical insurance projection from tremendous success to utter failure?
Permanent life insurance is, by definition, a long-term financial transaction in most cases, and the success of a nonguaranteed insurance policy is dictated by funding and the level of return. There can be massive differences in ultimate values based on relatively small changes at the higher returns and longer durations.
The Effect of Expenses
After the high expenses in the early years of almost any life insurance contract, the greatest expense is the cost of insurance (COI). As would seem obvious, the COI per dollar grows as the insured individual ages. The way life insurance works is that the COI is on the spread between cash value and death benefit. This is also known as the “amount at risk.” You’re basically self-insuring the cash value portion of the life insurance policy so the insurance company doesn’t charge you for that. If your $1 million life insurance policy has a $300,000 cash value, you pay the COI on the $700,000 spread. The older you get and the more the COI is per dollar of insurance, the less amount at risk you want. Otherwise, you’ll be paying enormous COIs if you’re lucky (or unlucky) enough to live beyond life expectancy.
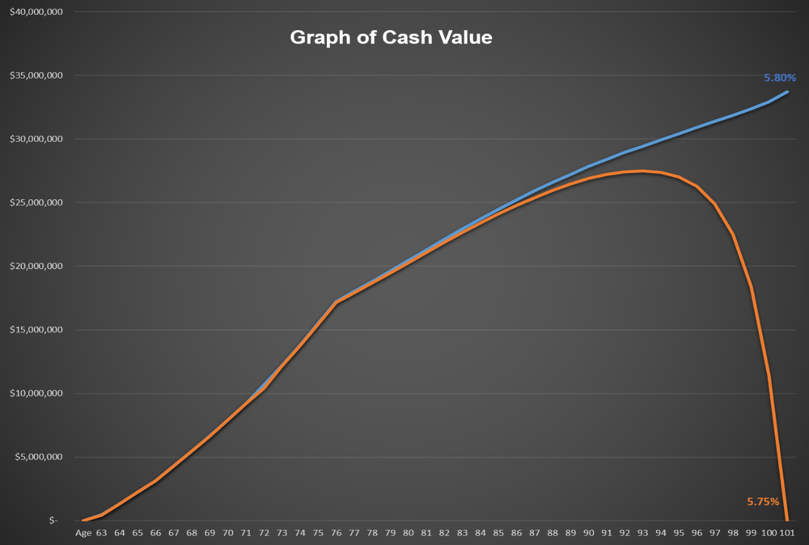
The bottom line is that we want there to be as much cash value as possible to minimize expenses (exactly the opposite of what too many insurance consumers think, which causes the untimely demise of their policies). If you earn 6% over time rather than 8% (or 5.75% rather than 5.8%) then the cash value will be lower, the amount at risk will be higher and the COI will be greater. This is a drag on the growth of the cash value, which in turn causes the spread to be greater yet, which increases the relative COIs, and the circle goes on over and over. If the growth of the cash value ends up not being able to keep up with the growing COIs, then the cash value growth starts slowing down, levels out, starts backtracking and then sinks into a death spiral that gains momentum before taking a header off a cliff where it’s dashed to oblivion on the rocks below.
Here’s a graph of cash values for the policy discussed in Part 1, assuming only a five-basis-point reduction in crediting rate.
A Retirement Analogy
John is 65 years old when he retires and has an individual retirement account with $1 million. We’ll assume he passes away at 95 years old, and he wants to live on $60,000/year. We’ll also assume his expenses are fixed and level over the years.
If John earns 6% annually and pulls out $60,000/year, his IRA principal will have shrunk to $715,000 but still provided all of his expected income. If his investment grew at 8%, the principal will have grown to $2,722,000 at death or he could have increased his retirement standard of living. If it grew at 4%, he would have run out of money before he died if he didn’t find somewhere to cut expenses.
However, one reason this example is unrealistic is that we’re assuming John’s expenses are level, and we know they won’t be. They will likely increase over time. How does this affect things?
Let’s assume a 3% inflation factor so John’s withdrawals must increase by 3% a year to maintain his standard of living. When we run these numbers, we see that the $1 million is no longer enough to support a $60,000 income stream growing at 3% and last to age 95. He’ll have to either reduce his retirement income or have put more money away. Given these assumptions, John needs an additional $250,000 in his IRA at age 65. Of course, if inflation is 4%, he’ll need even more. If he can manage to get a 7%, then the $1.25 million is enough to handle the 4% inflation, but he’ll be incurring more risk. For every action there will be a reaction.
Conservative vs. Aggressive
Let’s go a step further and look at the sensitivity of a more aggressive investing strategy relative to a more conservative investing strategy. If John assumed a 10% rate of return and 3% inflation, he’d only have to have about $800,000 in his IRA for everything to work out. If he assumed a much lower 4% rate of return and the same 3% inflation, he’d need about $1.6 million. In the aggressive scenario in which he planned on 10%, let’s assume he actually earned 9%. He’d run out of money five years earlier than planned. What change would it require in the conservative scenario to come up that short? The return would have to be reduced from 4% to 2% to experience the same five-year shortfall. This means that in the conservative portfolio, a 50% reduction in earnings rate (in an already less volatile portfolio) would be required to equal the effects of just a 10% reduction in earnings rate in the aggressive portfolio. That’s an astounding difference and shows how much more tentative planning is at the more aggressive levels.
If the 10% portfolio return fell to 9%, and the 3% inflation increased to 4% (akin to increased expenses), then the 4% portfolio with the same increased inflation would have to decrease to 1% (a 75% reduction) to experience the same shortfall. More conservative assumptions result in much more room for error because small changes just don’t have as much of an impact. The effect is exacerbated with life insurance, as discussed in Part 1, because a reduction in earnings is reflected in a much greater increase in expenses through higher COIs.
This rationale may make sense when thinking about the difference between 4% and 10%, but why the huge variations in a much narrower band of typical IUL returns, in our example between the 5% and 6% range?
The Effect of Expenses
It’s not just about the return. It’s about the return and about how it inversely affects expenses. Let’s focus on the 5.8% and 5.75% projections where the five basis point reduction results in the policy going from being a high flyer to being a gutter rat. At age 90, the 5.8% projection has interest credited that year at $1,767,000 with a COI of $1,123,000. At 5.75%, these numbers were $1,709,000 and $1,202,000, respectively. Not much of a difference, is there? Five years later at age 95, the 5.8% projection is at $1,956,000 of interest crediting and $1,458,000 of COIs with the 5.75% at $1,808,000 and $ 1,910,000, respectively. Now we see the gap opening. Remember how small changes mean big differences and how they compound over time? Five more years down the road at age 100, the 5.8% projection is at $2,118,000 of earnings and $1,620,000 of expenses with the 5.75% projection at $1,462,000 of earnings and $5,586,000 of expenses. Say what?! This is because in the 5.8% scenario, the amount at risk between the death benefit and the cash value is $3,359,000, and in the 5.75% scenario, it’s $17,343,000. How much do you think it costs to insure a 100 year old for that $14 million spread?
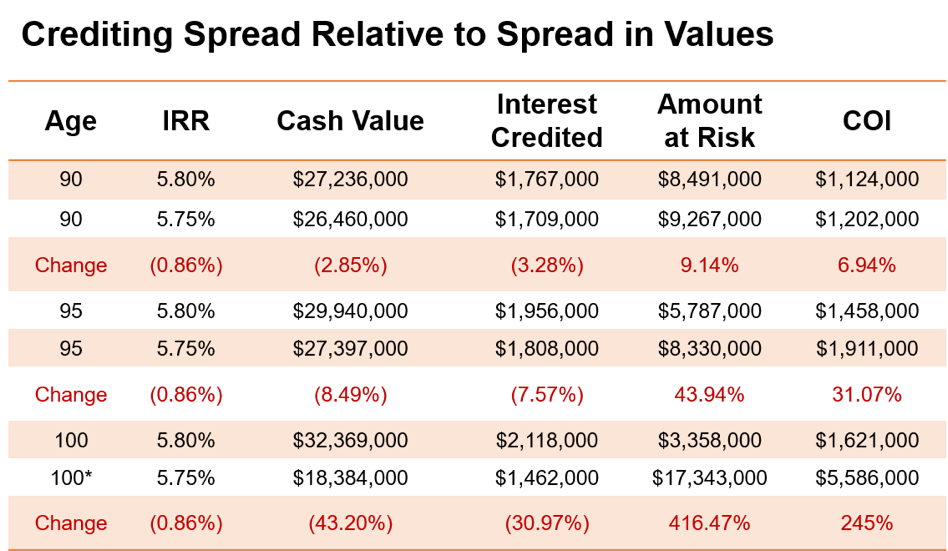
*Coverage terminates at age 102 at 5.75%
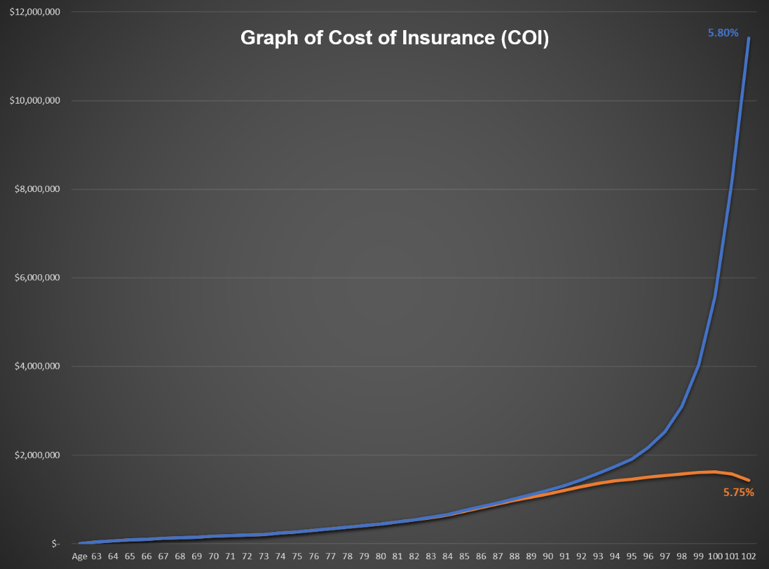
But we’re not done yet. You remember how the 5.75% deal fell apart at age 102? The COI that year that drove the nail into the coffin was $11,413,000 (yes, double the COI from two years earlier and almost 700% of the COI at 5.8%). In the 5.8% deal the COI is, actually, decreasing because the cash value is closing in on the death benefit as allowed under the Section 7702 rules.
So, while the crediting is in the 5% to 6% corridor, the return isn’t. The internal rate of return (IRR) on the cash value from age 100 to 101 on the 5.8% projection is 1.79% net of expenses, while the IRR from age 100 to 101 on the 5.75% projection is a negative 38.1% net of expenses. The actual crediting of the existing cash value is the same percentage on the two scenarios, but the expenses are vastly different, so the total return is different. We know the bigger the return number, the more sensitive the values are, but it doesn’t matter if it’s positive or negative, it’s just about the magnitude of the number. The effect of the expenses on the contract pushes the apparent modest return of five point something percent, which shouldn’t be terribly sensitive, into the stratospheric range of returns making the transaction tremendously sensitive.
The dramatic increase in the negative return is making a larger difference in a shorter period, which is why the policy falls off a cliff and is dashed on the aforementioned rocks.
Couple this with all the other unrealized and misunderstood aspects of how IUL really works and you’ll understand why I predict there will be a great wailing and gnashing of teeth regarding IUL policies in the coming years.
Bill Boersma is a CLU, AEP and LIC. More information can be found at www.OC-LIC.com, www.BillBoersmaOnLifeInsurance.info, www.XpertLifeInsAdvice.com, www.LifeLoanRefi.com, TheNAPIC.org, www.LifeInsExpert.com or email at [email protected].


