
In the course of reviewing so many premium financing proposals and transactions, I have the opportunity to dive deep into many indexed universal life (IUL) contracts. While premium financing has many complexities that go unrealized by consumers, even fewer understand the complexities of the life insurance product the already complex transaction is built on.
I’ll focus on a recent case in which my services were procured through the estate-planning attorney for a potential premium financed policy owner. I’m not going to muddy the waters by naming the insurance company or the product because it really doesn’t matter. I’ve seen the same thing over and over through the years and have written about it before.
In the course of review, one of multiple focuses is generally on the assumed crediting rate of the proposed policy and the crediting rate sensitivity to policy success. To set the stage, in today’s market, a typical crediting rate is in the 6% range based on specific policy features and AG49A rules. In the specific contract I was reviewing, the assumed rate was 5.92%.
One thing I find interesting is that while there may be spreadsheets presented to the consumer and advisors assuming different loan interest rates, I seldom see spreadsheets assuming different policy crediting rates. While the given rate may seem rather conservative to the typical uneducated consumer (uneducated in the fine points of IUL contracts that is) who sees a crediting rate hundreds of basis points lower than the long-term return of the stock market, that consumer has almost no idea of how that rate comes to be. The short answer is that the rate is nowhere near as conservative as it appears or is purported to be. Also, the real life sequencing of returns makes a bigger difference than most people understand. (For a deeper dive into this you may want to read these articles: Digging Into the Black Box of Life Insurance and IUL: Backtesting and Cap Rates and Averages, Oh My!).
Sensitivity Testing
To drive this point home, I’ll often do a bit of sensitivity testing. This is really quite simple and involves running multiple projections at a variety of assumed crediting rates. As would be relatively obvious, running a projection assuming 4%, for example, would result in a dramatically different outcome. However, what if we run much smaller deviations?
In the case at hand, in addition to the 5.92% I ran 5.85%, 5.80%, 5.75%, 5.5%, 5.0% and 4.5%. Here are the results:
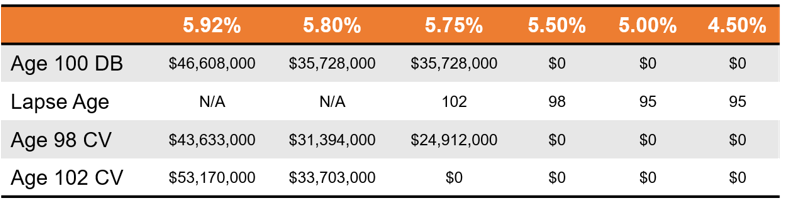
At the 5.92% assumption, we see a very healthy contract with tens of millions of cash value and a growing death benefit. At 5.85% and 5.80%, things still look attractive at a glance though the death benefit at age 100 is reduced by over $10 million, not an insignificant amount. At 5.75%, the story starts to change. At this rate, the policy lapses at age 102. While you specifically might not think you’ll make it to 102, let’s still look at the numbers. At 5.92% and 5.80%, the cash value at 102 was $53,170,000 and $33,703,000, respectively; a $20 million spread in death benefit for a 12-basis-point spread in crediting. That’s a 38% drop in death benefit for a 2% drop in crediting. Ouch! At 5.75%, the cash value is $0 at the same age. So a drop of five basis points more burns through $33 million in cash value and the death benefit is gone. That’s a crediting drop of less than 1%, resulting in a drop in death benefit of 100%. Interesting.
At 5.5%, the policy succumbs at age 98 so we see a 25-basis-point drop burn through $25 million at age 98. Now let’s ask the question that begs to be asked: If you invested in anything else assuming or modeling a 5.8% return and experienced a 5.75% return, would you be disappointed? I don’t think so. Who really cares about a five basis point spread? After all, the fees in the contract are already hundreds of basis points, and the fees paid to your financial advisors on your investments are likely 10, 20 or 30 times that percentage.
While this is admittedly oversimplifying things, would you ever enter a transaction in which the distinction between success and financial ruin is defined by a razor thin margin? Assuming you understood this, of course you wouldn’t. But that’s the key … do you understand this? Most don’t.
Don’t Rely on the Ledger
Let’s focus on some other truisms here. What’s the one thing we’re absolutely and supremely confident in regarding the ledger underscoring the entire transaction? It’s guaranteed to be wrong. That’s right. We all intellectually know that there is a 0% chance the proposal will turn out the way it is projected. Statistically, it will be either better than or worse than what we see on paper. Again, that’s a certainty. Unless you’re willing to state that the entire stock market will perform on a perfectly level basis day in and day out, year after year forever and at a level that nets precisely 5.92% after all charges and that those charges never change and the cap rate of the policy and options charges in the market never change, the only thing the sales ledger proves is that ink sticks to paper.
So the question now is more about the likelihood that the transaction will perform better than or worse than the proposal over time. To answer that, let’s look at where the 5.92% in the proposal came from. The short answer is that it came from the Actuarial Guidelines 49A rules. These are based on the 65 most recent 25-year durations of the S&P 500. There’s more to it than that but I’ll leave it there. Furthermore, the maximum allowable crediting rate is based on the geometric mean of these thousands of data points, which means the maximum illustratable rate is an average which means that 50% of the time the policy would historically have done better and 50% of the time it would have done worse. A 50/50 shot is what you’re looking at.
Knowing this, I’d certainly want to know where the 5.92% lines up relative to that maximum allowable projection rate. The answer … 5.92% is the maximum allowable projection rate. That’s right, the supposedly reasonably conservative projection is based on the regulatory maximum assumption, which itself is based on a 50/50 proposition.
I’m not picking on this transaction because it’s built like it is. This is how I always see it. In my writing, I generally use a lot of qualifiers and seldom say always, never, etc. However, the maximum allowable rate is the rate I always see. That’s not to say that’s the rate that everyone in the market uses. It's only that this is the situation for what hits my desk.
As I wrap up this piece, I’ll share another interesting observation regarding the multiple projections I ran. While the differences in the outcomes resulting from tiny spreads in presumed crediting rates at the higher end are in the tens of millions of dollars, on the other end the projections for 4.5% and 5% show the policy lapsing in the same policy year. In other words, a 50-basis-point difference, 10 times as much as the spread between 5.75% and 5.80% that results in a difference measured in tens of millions of dollars, doesn’t even change the lapse year.
In Part 2 I’ll delve into the details of why this is.
Bill Boersma is a CLU, AEP and LIC. More information can be found at www.OC-LIC.com, www.BillBoersmaOnLifeInsurance.info, www.XpertLifeInsAdvice.com or email at [email protected].


