I’m not sure what one really can make of the last week of summer, though I’m inclined to put emphasis on the calendar more than the surrounding inputs I think.
We have, for instance, the aftershocks of a Jackson Hole meeting and set of Federal Open Market Committee Minutes that, while largely touted as dovish, wasn’t so dovish for the market as to stop Dec. Fed Funds from hitting a new, albeit marginal, high at 2.23-plus percent, putting odds of a hike that month at near 65 percent.
Nor were there many aftershocks from the Cohen/Manafort “thing” even as the accountant Weisselberg enters the fray. Not much new came out over in Turkey, though no news wasn’t quite good news even if Germany lends a hand. We find some sort of a deal with Mexico, and we’re yet to hear how Canada fits in. Then the trade talks with China cooled off, but maybe with a Mexico win, Trump feels less concerned about doing a deal with China. Or maybe the bloom coming off the rose of a Nobel prize deal with North Korea is just a negotiating strategy. Whatever, the markets didn’t seem to react very much so maybe it is about summer’s end.
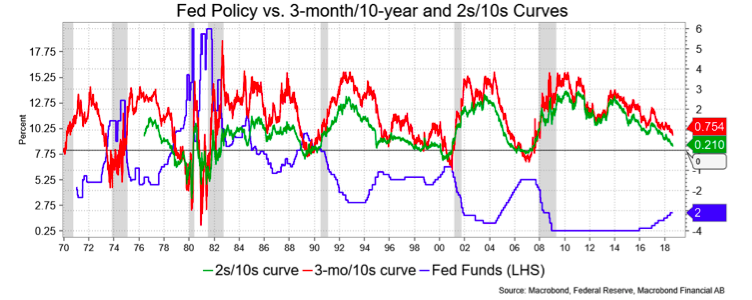
Which may be why a couple of Fed pieces telling us little we didn’t already know about the yield curve (but doing so with style) garnered so much attention. One was a SF Fed’s Economic Letter about “Information in the Yield Curve about Future Recessions.” The paper talks about the 3-month/10-year spread as being the most reliable and concludes it’s still a comforting distance away from a recessionary-warning inversion. They don’t dismiss the more popular 2-year and 10-year Treasurys, by the way, and as the chart below shows, they track each other very well. The St. Louis Fed also agreed that an inversion was a good recession signal and included a trough in the unemployment rate as another good signal, preceding a recession by on average nine months. Is that a surprise? The challenge is determining that trough though an inversion typically precedes it. In short, watch the curve.
Before I talk about this a little bit more, let me just say that both curves are flattening sharply and that that simple behavior is enough to warrant caution about the economic outlook they provide. Further they cite the 3-mo/10-yr spread at “slightly below 1 percent” and hence a cause of some comfort, i.e., not inverted. Well, that spread is about 20 basis points narrower now versus when they cited their level.
Something the authors state and about the yield curve more generally is that it’s important to make the distinction between cause and correlation. Curve inversion correlates with recessions, but correlations don’t identify cause and effect complicating interpretation. They address some of that by looking at term premium versus outright longer yields but found that approach was less accurate than simple curve observations.
They took on the impact of quantitative easing, the idea being that the QE depressed long yields more than they otherwise would be and so the curve is flatter than it might otherwise be. They get over that saying that the impact of QE is a big “if” since the assumptions are based on assumptions. Further, the comment that lower-term premiums have contributed to problems in the past (overheating) with no evidence that this time is different.
I talk a lot about the curve and want to emphasize how much attention it’s been getting from the Fed, pundits like me, the public and recently Mnuchin. Look up “flat yield curve” on Google and you’ll see over 21 million results though that may be skewed, according to Trump, by an effort to see the flat curve as a harbinger of bad things to come, like a recession.
The idea that “this time is different” came up a lot so let’s address that. First, assuming that the QE did have an influence, it’s pretty clear that influence was small given that the QE is running off, supply increasing, and the curve still flattening.
Second, let’s try to handicap the influence and I’ll make up a number. Say there had been no QE, where would yields be? Before we get there, just consider what no QE may have meant for risk assets: presumably not as strong and so something of a dampener on rates. Leaving that aside, I’ll toss out that without QE, 10s would be 65 basis points higher, a pure guess. Assuming all other things being equal, that would make the current 2s/10s spread about 65 bps, or 40 bps steeper. Why not more? Don’t forget that QE also involves selling short Treasury.
The curve would still have flattened, albeit less so. That would not change the curve’s direction or anticipation for Fed hike leaving us, today, with a pretty secure anticipation for four more hikes, resulting in 100 bps by the middle of 2019. So here we’d be with 10s at, roughly, 3.55 percent, for a real yield of 1 percent, presumably a firmer dollar and all the more alluring against the stock market, which is to say, that the next set of hikes would certainly get us to inversion soon enough to anticipate a recession by the 2020 election.