
It’s probably no news to you that the recent flight to quality has hit the U.S. Treasury market hard. Yields on government debt have sunk precipitously amid a flurry of safe haven buying. Intermediate-term debt has been especially impacted. In the past year, the yield on the 10-year T-note has shrunk 130 basis points. Meantime, the rate on 7-year paper fell 138 basis points.
Chart 1 — Yield Curve Shift
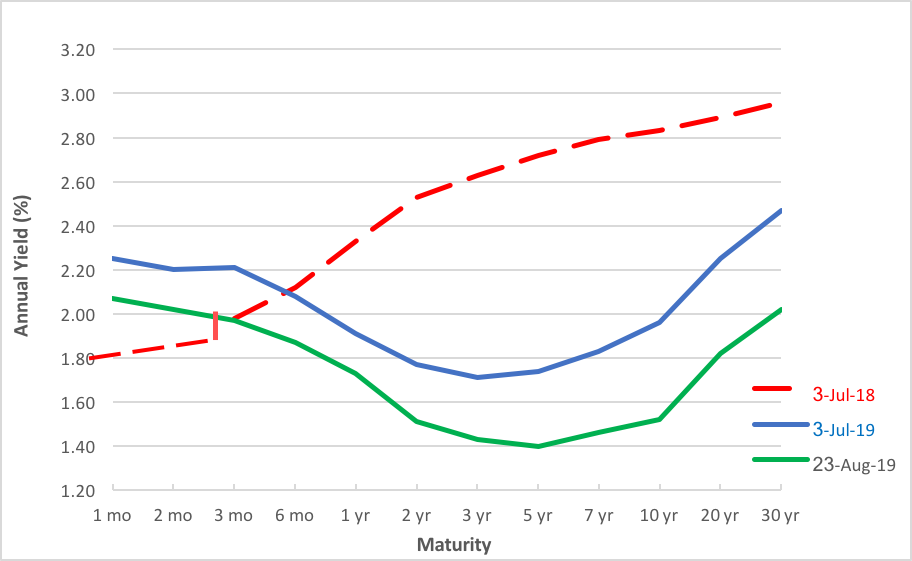
In just 12 months, the middle of the yield curve slumped by half as economic expectations soured. That’s affected the spread in the prices of exchange traded funds tracking Treasury Inflation-Protected Securities (TIPS) and conventional Treasury notes.
Launched in 2003, the iShares TIPS Bond ETF (NYSE Arca: TIP) tracks a capitalization-weighted index of inflation-protected debt with at least one year remaining till maturity. At present, the average maturity of TIP’s holdings is a little over eight years. A stablemate, the iShares 7-10 Year Treasury Bond ETF (Nasdaq: IEF), proxies traditional coupon government paper with roughly the same average maturity as the TIP fund’s components.
The spread between these two ETFs mirrors—in a literal sense—a widely followed bond market indicator. That indicator, known as the TIPS spread, is the yield premium commanded by the conventional 10-year Treasury note over the 10-year TIPS. The spread reflects the inflation compensation expected by investors over the upcoming decade. The wider the spread, the higher investors’ expectations; smaller spreads denote shrinking expectations.
Long-term observers may recall how the TIPS spread sharply contracted in the run-up to the Great Recession of 2007-2009. In the heady summer days of 2007, the spread had widened to the 260- to 270-basis-point level, but as the economy slipped into recession, the spread narrowed to ultimately bottom at 4 basis points in November 2008. If you aren’t a long-term observer, just take a look at Chart 2’s depiction of the yield spread. The timespan of the Great Recession is highlighted in red.
Chart 2 — Yield Spread: 10-Year Treasury Notes vs. 10-Year TIPS
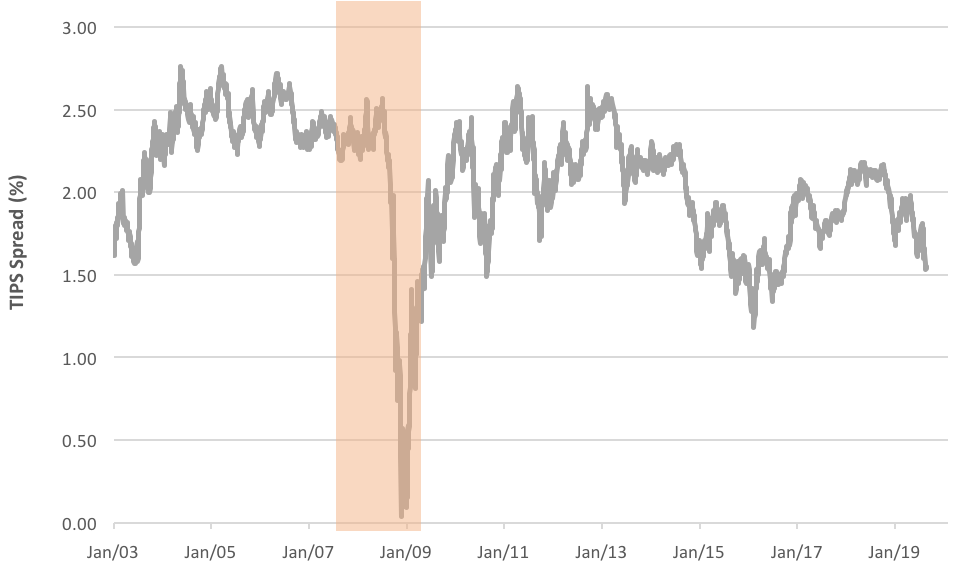
Currently, the spread’s worth 154 basis points but seems likely to continue narrowing. Why? That’s where the mirroring comes in.
A complementary view—mirrorlike, if you will—of the trend is found in the TIP-IEF price spread. Keeping tabs on the spread (IEF’s cost subtracted from TIP’s) allows you to easily monitor the yield spread’s twists and turns. The chart of the price spread (Chart 3) shows a rather worrying technical formation.
Chart 3 — TIP-IEF Spread Mirrors Yield Spread
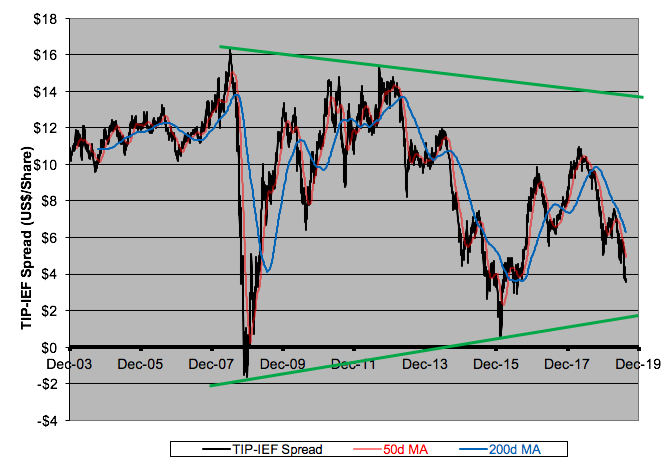
See the green lines? They connect the spread’s declining highs and rising lows, forming a wedge shape. A breakout from a wedge usually presages a significant trend. The spread’s now racing toward the lower boundary of the wedge. If the spread pierces the support line, it sets up a downdraft that could shave as much as $18 off the price differential. That could invert the spread, making IEF more expensive than TIP. The last time that happened was during the December 2008 depths of the Great Recession. YIKES!
The spread could, of course, rebound off the support line. That wouldn’t necessarily obviate an ultimate contraction in the spread; rather, it would move the potential breakout point north, at least until we reach the apex of the wedge. The possibility of a dramatic breakout diminishes greatly once we get past the three-quarters point (timewise) in the wedge formation.
Then there’s the question of velocity wrought by the differential in the underlying instrument’s convexity. Convexity measures the change in duration for a given shift in rates. Positive convexity indicates that duration, i.e., interest rate sensitivity, contracts when interest rates fall.
Presently, convexity for the TIP fund is 1.11; for IEF, it’s 0.64. With TIP’s convexity greater than IEF’s, the inflation-protected securities fund is more interest rate sensitive, an artifact not revealed by a simple comparison of the fund’s effective durations. TIP’s duration is just slightly longer than IEF’s but will get even longer in a falling rate environment.
The bottom line? As long as the TIPS spread (and, by implication, the TIP-IEF spread) shrinks, IEF is a buy. From here, there’s room for a 26% uptick in the Treasury note ETF. But when the spreads start shrinking—IF they start shrinking—buyers are likely to be more interested in the TIP fund.
Brad Zigler is WealthManagement's alternative investments editor. Previously, he was the head of marketing, research and education for the Pacific Exchange's (now NYSE Arca) option market and the iShares complex of exchange traded funds.


