
With just over two months left in the year, ETF demand has been slightly better than last year, but flows will need to accelerate if they are to match or exceed the more than $300 billion of net inflows in 2018, mostly due to two very strong inflow months in November and December of last year for large-cap equity ETFs. In 2019, fixed income and lower-risk equities have been the darlings.
According to ETF.com, year-to-date ETF inflows as of October 17 of $212 billion were ahead of the $202 billion of new money pulled in a year earlier. This year, 57% went to fixed income ETFs ($120 billion), despite the category comprising only 20% of the overall asset base.
In fact, five of the 10 largest fund inflows were in fixed income this year, compared with just two last year. And the mix of fixed income funds from last year to this shows a dramatic change in investor expectations and market dynamics.
Last year, iShares Short Treasury (SHV) gathered $7 billion, making it the fifth-most popular ETF overall and just behind four equity funds. This year, iShares 20+ Year Treasury Bond (TLT) brought in $8 billion of new assets. Investors have been eager to take on interest rate risk to find higher income as bond yields shrank and the Federal Reserve cut interest rates multiple times. Last year, investors were concerned about the impact of rising rates and sought the safety of cash-like securities. TLT’s average duration of 18 years makes the ETF much more rate sensitive, and risky, than SHV, which has an average duration of just 0.4 years.
TLT’s flows were second only to the $9 billion gathered by Vanguard Total International Bond ETF (BNDX) for the lead among fixed income ETFs. However, we think BNDX’s demand stems from growing usage of international fixed income ETFs for asset allocation purposes. BNDX charges a miniscule 0.09%, but it too incurs interest rate risk with an average duration of 8.1 years.
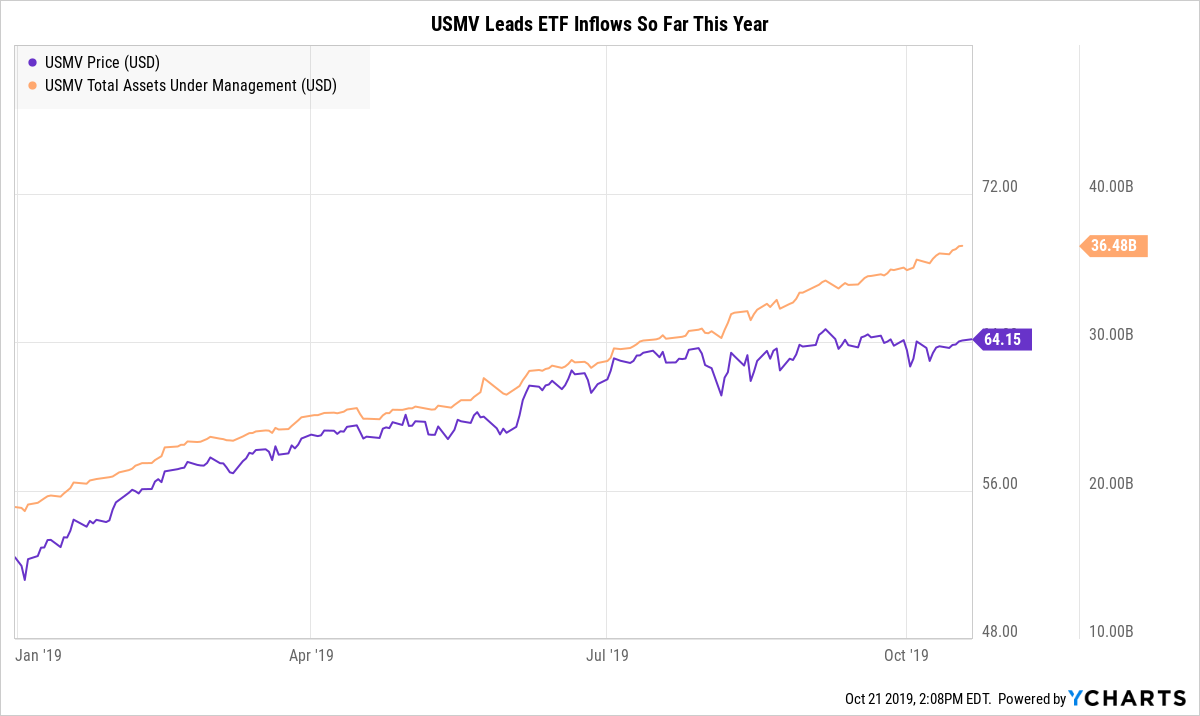
However, the current ETF industry flows leader has been iShares Edge MSCI Minimum Volatility (USMV), which pulled in $13 billion. USMV has just $36 billion in assets, but demand has accelerated in the past five years. At the end of 2014, USMV had $3.6 billion in assets and was smaller than low-risk peer Invesco S&P 500 Low Volatility (SPLV). However, SPLV’s asset base has risen only to a current $8.5 billion, despite $3 billion of inflows in 2019.
USMV provides more sector diversification than SPLV—exposure to cyclical sectors like Information Technology and Consumer Discretionary are higher based on CFRA's review of ETF holdings—and charges 10 basis points less, which likely has contributed to its relative success. Both ETFs have outperformed the S&P 500 Index in 2019, despite a continuation of the longest bull market in history.
However, since the beginning of September 2019, SPDR S&P 500 (SPY) and iShares Core S&P 500 (IVV) have gathered higher inflows than USMV, a sign of investors willing to incur full equity market risk as the year ends. CFRA thinks that if the industry is going to again exceed $300 billion of net inflows, SPY, IVV and other similar products will need to do some heavy lifting.
CFRA is hosting a webinar to discuss the biggest winners and losers during the ETF boom looking back over the past five years as well as the impact on asset management stocks. Register or hear a replay at https://go.cfraresearch.com/etf-winners-and-losers.
Todd Rosenbluth is the director of ETF and mutual fund research at CFRA. Learn more about CFRA's ETF research here.


