
Dividend growth accelerated in the fourth quarter of 2020. There were only 57 negative dividend actions—cuts or suspensions—taken by U.S. companies in the three months ended December 2020, a significant decrease from the 102 occurring a quarter earlier according to S&P Dow Jones Indices and 74 a year earlier. Meanwhile, there were 620 positive dividend actions—increases or initiations—in the fourth quarter, up from 309 in the prior period but down from the 686 a year ago. The positive/negative fourth quarter breadth improved to 10.9 (from 9.3 a year ago)—the highest fourth-quarter level since 2014 (14.5). However, there is still room for improvement in 2021 for companies suspending dividends in the second quarter of 2020, as the U.S. economy likely recovers in 2021 and companies adjust operations to the new normal.
Figure 1: Ratio of Positive/Negative Dividend Actions by U.S. Companies
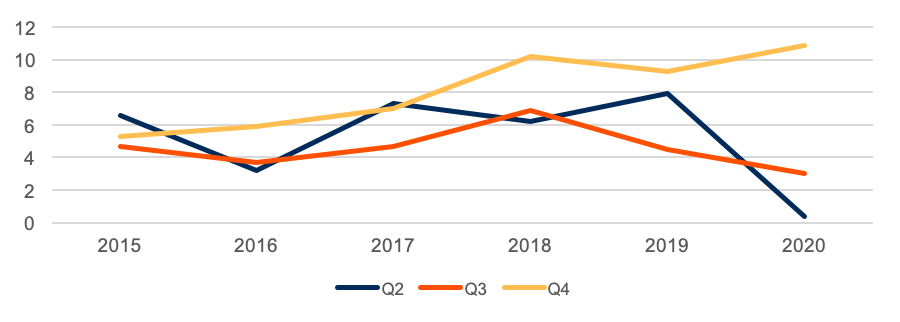
Source: S&P Dow Jones Indices. As of December 31, 2020.
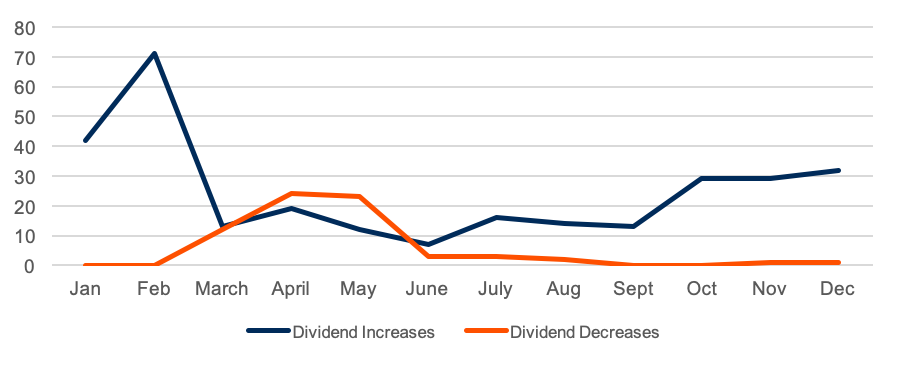
In 2020, 298 S&P 500 constituents took positive dividend actions during the year. While this was the first in the last eight years where fewer than 300 companies in the index raised or initiated a dividend, we are encouraged that dividend reduction efforts among the large caps waned. There were just two dividend decreases and no suspensions in the final three months of 2020, in contrast to 19 dividend decreases and 40 suspensions in the three months ended in May. Meanwhile, 84 S&P 500 companies raised the dividend, while four initiated a dividend during the fourth quarter of 2020 with 32 positive dividend actions in December alone, the third-highest monthly total behind January (42) and February (71).
Figure 2: Number of Monthly S&P 500 Dividend Actions in 2020
Dividend increases occurred across a variety of sectors. In 2020, Health Care, Utilities, Consumer Staples, and Financial companies in the S&P 500 were most likely to hike or initiate a dividend of actions taken were a positive one at 94%, 93%, 90%, and 90%, respectively. The historically growth-oriented Information Technology also shifted more toward an income-generating one, as 89% of the sector’s dividend actions led to higher income for shareholders. Apple, Chubb, DTE Energy, Johnson & Johnson and Procter & Gamble are some examples of companies raising dividends in 2020, in addition to being attractive to CFRA for 2021.
Figure 3: Sector Breakdown of Dividend Actions (%)
S&P Dow Jones Indices. As of December 31, 2020. Excludes companies that maintained annual dividends.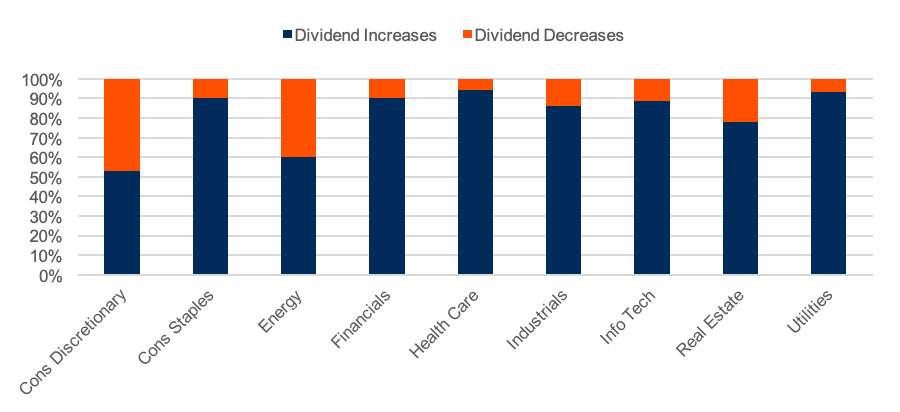
In contrast, just 60% of S&P 500 Energy companies and 53% of Consumer Discretionary S&P 500 constituents had positive dividend actions. Within energy, seven companies cut dividend payments during 2020, with an additional three suspending payments. Meanwhile, 21 Consumer Discretionary companies paused in making dividend payments and another three slashed the dividend. Suspending the dividend was also relatively common for Industrials companies, with five firms taking negative action.
What’s inside dividend growth ETFs can vary. CFRA’s ETF rating methodology combines holdings-level analysis with fund metrics, including performance and costs. Despite similar names, dividend ETFs like iShares Core Dividend Growth ETF (DGRO), ProShares S&P Dividend Aristocrats ETF (NOBL) and SPDR S&P Dividend (SDY) provide unique exposures.
DGRO has a higher stake in Information Technology (20% of assets) than these ETF peers but owns few Utilities (2.5%) and no Energy stocks. Meanwhile, Utilities is one of SDY’s largest sectors, with a 12% position in the sector, but the ETF has only a 2.6% weighting in Information Technology. SDY also has a 7% stake in the Energy sector. In contrast, NOBL has the most exposure to Consumer Staples (19%), but an even lower 1.6% weighting in Information Technology.
While 0.35% expense ratios of NOBL and SDY are higher than DGRO’s 0.08% fee, these funds’ record has been driven by the securities inside. Indeed, DGRO rose 11.2% in the 3-year period ended January 13, 2021, higher than NOBL’s 10.2% and SDY’s 7.6%. Yet, CFRA cautions focusing too heavily on a 3-year record when selecting an ETF.
Figure 4: Sector Exposure of Select Dividend ETFs (%)
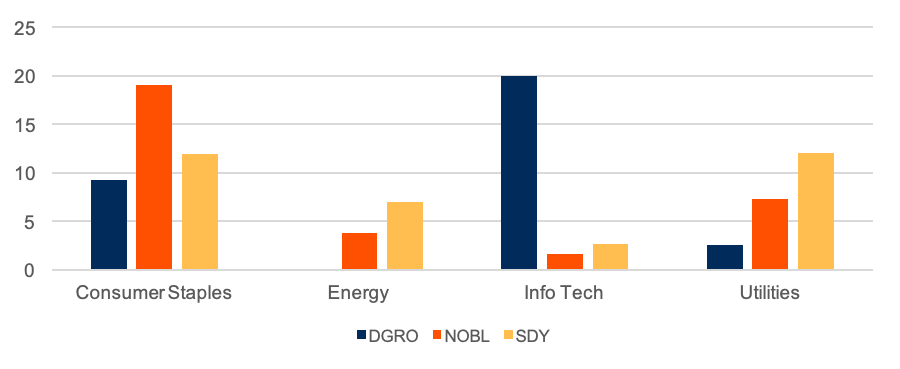
CFRA’s First Bridge ETF Database. As of January 14, 2021.
Conclusion
In the fourth quarter, many S&P 500 companies continued long records of dividend growth and put in the rearview mirror the suspensions and cuts made by peers earlier in 2020. However, investors seeking diversification benefits through dividend ETFs are reminded to look inside and not just at the relative past performance or expense ratio.
Todd Rosenbluth is the director of ETF and mutual fund research at CFRA. Learn more about CFRA's ETF research here.


