
Remember this chart?

We’ve featured it in a few recent columns, the last being May 19’s “Well, THAT Happened”. In that column, we made the case that the current bull market didn’t seem to be in imminent danger despite investors’ growing wariness. Now, with a breakout from more than three months of consolidation, equities seemed to have re-established some upward momentum.
However, there’s still a nagging decline in risk appetite readings. The red line in the chart above tells us that participation in the S&P 500’s record high last week was narrow. Now, don’t get me wrong, my frequent reference to this risk indicator is not a jeremiad; it’s more of a reality check than a volatility check.
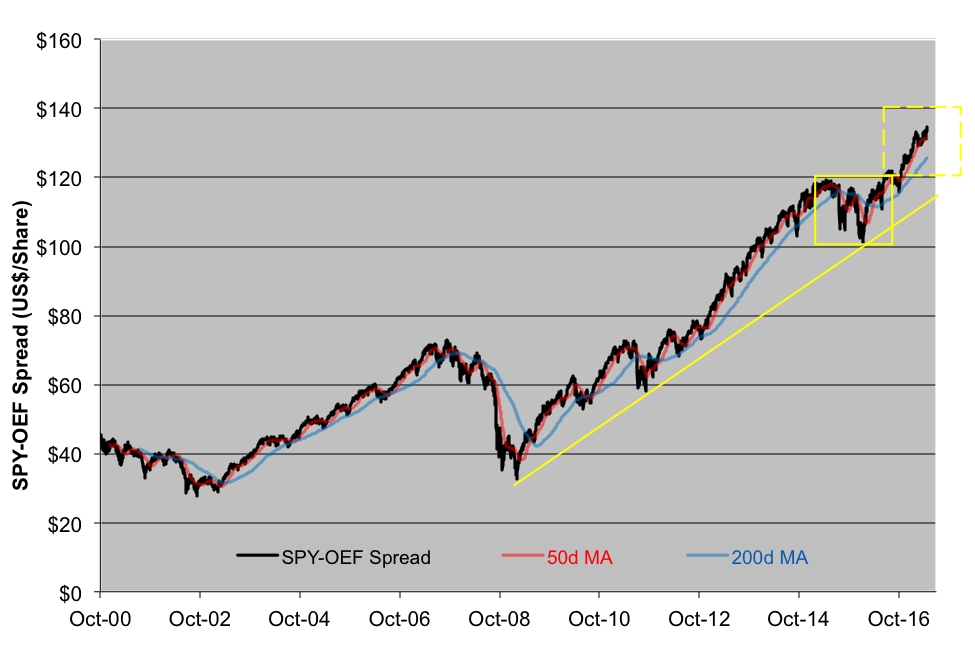
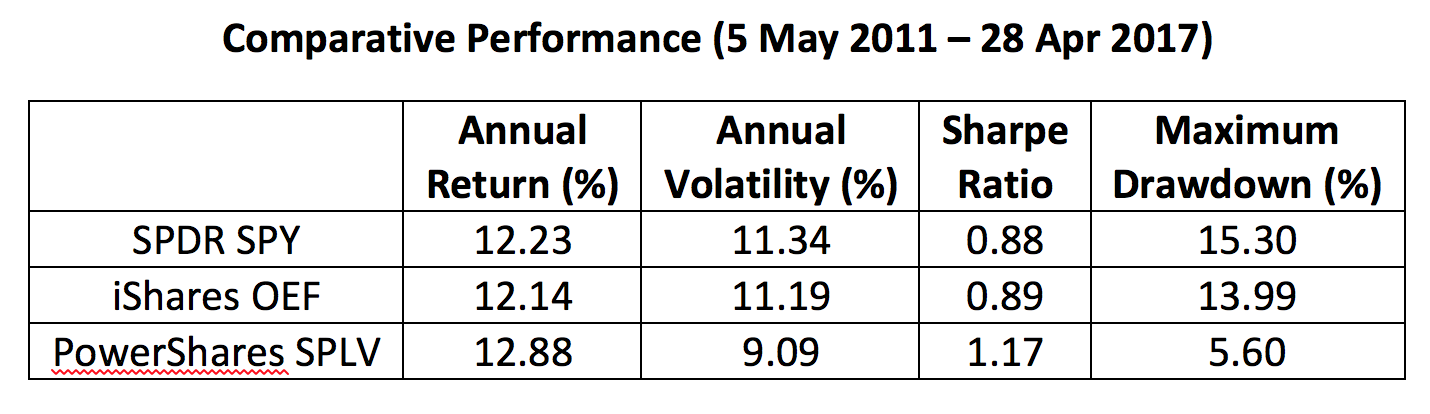
You see, there’s an equally compelling indicator that signals, indirectly at least, a near-term target on the upside. If you track the premium of the SPDR S&P 500 ETF (NYSE Arca: SPY) over the iShares S&P 100 ETF (NYSE Arca: OEF), you’ll see something like the chart below. OEF is composed of the S&P 500’s most liquid and highly capitalized stocks. OEF is what you’d recommend to your granny if she wanted broad market exposure. Why? Because she’s likely to get about the same return as the S&P 500 with less risk. Proof of that is found in the table below. Over the last six years — the lifespan of our bellwether PowerShares S&P 500 Low Volatility ETF (NYSE Arca: SPLV) — OEF’s worst sell-off was notably smaller than SPY’s. For the record, SPLV is one of the determinants of the Equity Market Risk Appetite Indicator.
When equity investors feel defensive, they gravitate to OEF’s stocks; when they’re expansive, SPY’s roster is more appealing. Thus, the dips and fits in the SPY-OEF spread are indicators of investor sentiment.
Presently, the spread is about $134 per share, but its chart points to a near-term objective of $140 or so.
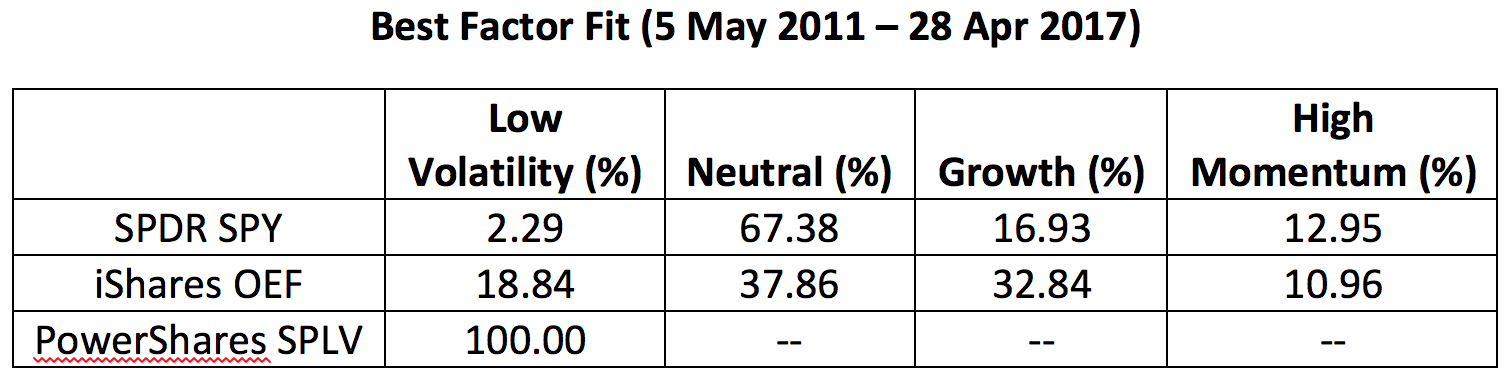
While OEF may suffer less dramatic drawdowns, it’s not really a low-volatility play. You’ll note the better hedge is the SPLV fund. That’s no surprise, given its factor exposure — it’s 100 percent low volatility. OEF, on the other hand, offers a more modest dose, along with slugs of other SPY factors.
Bottom line? Yes, there is upside potential for stocks. As we mentioned in our last column, the S&P 500 is still aiming for the 2,525 level. We’d caution investors, though, to keep an eye on the SPY-OEF spread as barometer of market sentiment. You’ll need to reassess the market’s potential once SPY’s premium reaches $140, especially if its 50-day moving average (50d MA) crosses below its 200-day marker (200d MA). And whatever you do, manage your volatility.
Brad Zigler is WealthManagement's Alternative Investments Editor. Previously, he was the head of Marketing, Research and Education for the Pacific Exchange's (now NYSE Arca) option market and the iShares complex of exchange traded funds.


