
See the chart below? It traces the spread between the 10-year Treasury note rate and the S&P 500 dividend yield. Think of the spread as a leading indicator of stock investor sentiment. Pretty volatile, isn’t it?
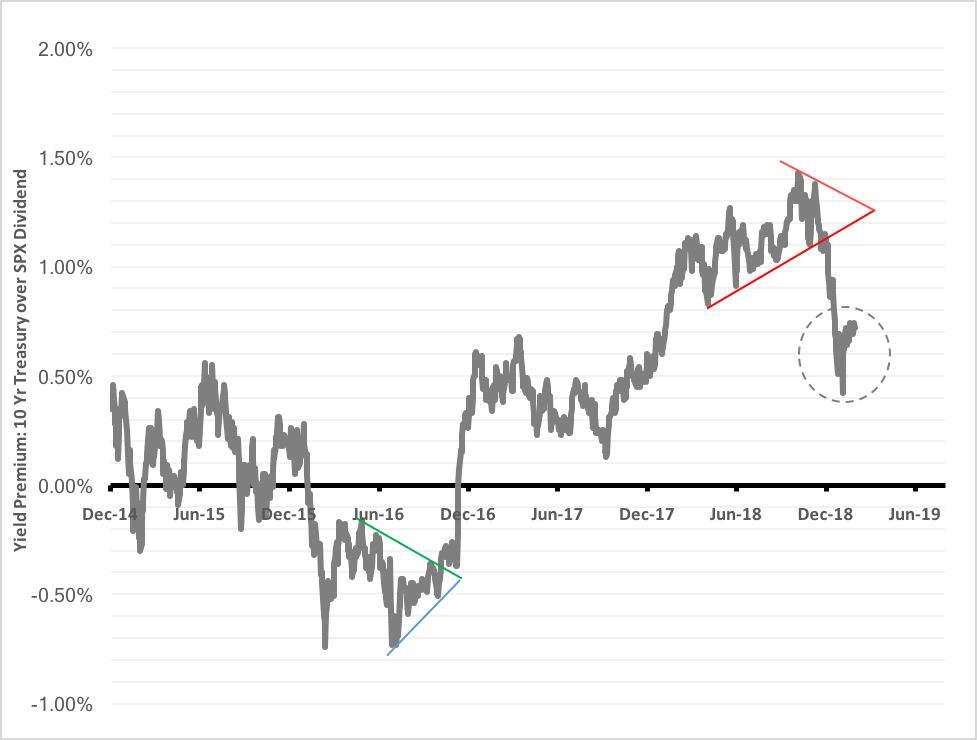
Presently, the yield premium offered by the 10-year T-note over stocks is 0.8 percent. All other things equal—and they’re not—the payoff for holding Treasury paper is higher than that for stocks. ‘Twas not always so meager. As you can see, the payoff bonus actually peaked near 1.4 percent in October 2018.
A strong equity market, together with Fed tightening, bolstered the premium through most of 2018. As stock prices soared, dividend rates naturally shrank. Meanwhile, yields on government obligations were nudged upward by central bank policy, putting pressure on bond values. Then, all that started to unwind in the wake of the November 2018 election. The premium broke below its congestion area and wiped out two years of work before rebounding in January.
So, what happened and why should you care?
First, the what. History shows that a high yield premium can signal trouble ahead for equity investors, just as a discount, last seen in 2016, portends positive forward stock returns. Last year, the Center for Financial Research and Analysis released a long-term study of the relationship between the S&P 500 and government paper.
Here’s where the why comes in. CFRA found that prospects for future stock gains dim significantly when the Treasury yield premium exceeds 1 percent. Prescient, that. The research report was released just in time to warn stock investors of the trouble awaiting them. You did read the report, didn’t you? And acted accordingly?
So now the yield premium’s under 1 percent again. Did the market just blow off excess steam? Does that rebound on the chart signal another round of speculative buying ahead? There’s a clue in another chart.
The topping action exhibited by the S&P 500 last year was accompanied by shrinking market breadth. Basically, it was concentration risk writ large. As in large caps. They just got larger and larger. We can see that when we put up the Invesco S&P 500 Equal Weight ETF (NYSE Arca: RSP) price in ratio to that of the SPDR S&P 500 ETF (NYSE Arca: SPY). Both ETFs track the very same stocks but RSP’s equal weighting scheme allows the smaller issues greater expression. The red line in the chart below traces the breadth ratio; the black line is SPY’s price. Notice how the breadth ratio’s been trading under its one-year moving average (the blue dots) since 2017?
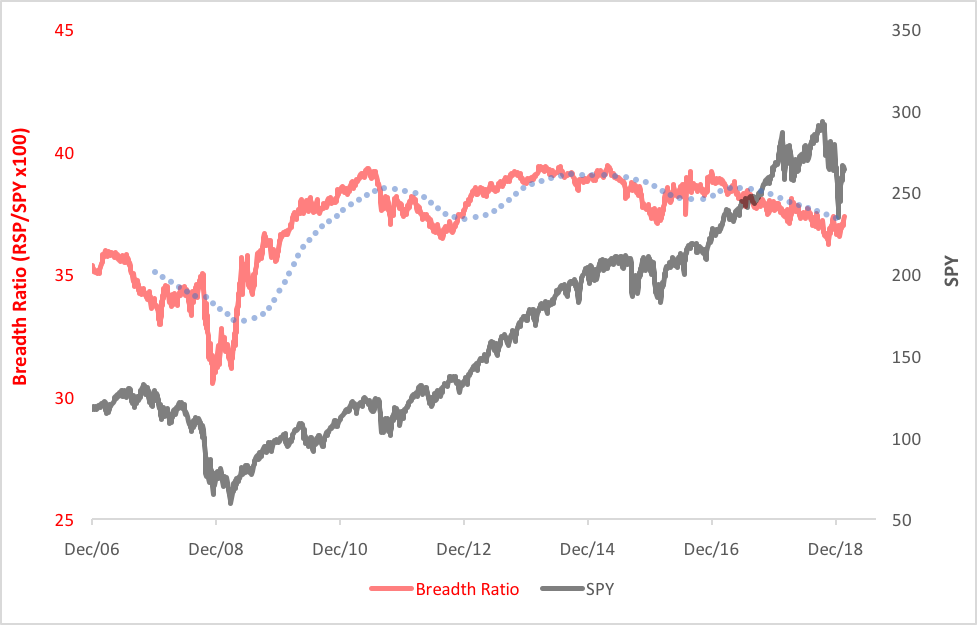
Well, no longer. For the past three trading days, the breadth ratio’s been “above average,” so to speak. That’s a sign that the stock rebound has some real legs. To date, RSP’s gained 7.9 percent versus SPY’s pickup of 5.4 percent.
The question before us now is whether those legs can hold up through the rest of the year.
Brad Zigler is WealthManagement's Alternative Investments Editor. Previously, he was the head of Marketing, Research and Education for the Pacific Exchange's (now NYSE Arca) option market and the iShares complex of exchange traded funds.


