
Back in March, as the markets reeled from a dizzying hike in global petroleum prices, we examined tactical allocations to oil ETFs to hedge inflation’s corrosive effect on portfolio values.
Over the past quarter, energy ETFs have done yeoman’s work, handily outperforming other sector funds. But now with petroleum prices moderating, it’s looking like investors and their advisors are lifting their oil hedges in favor of more strategic allocations. Net outflows from energy ETFs have approached $6.4 billion in the past three months.
And if there’s a sector that comes to mind as markets begin to focus on the possibility of recession, it’s bound to be utilities. About $2.3 billion flowed into utility ETFs this past quarter as the average portfolio appreciated 3.3%.
What makes utilities so attractive? Dividends, for one thing. Annual yields average 2.9% for the top five broad-based utility ETFs, about twice the cash throw-off rate for the S&P 500 and 20 basis points (0.20%) better than the nominal 10-year U.S. Treasury note.
Then there’s the issue of volatility. Or rather, utility funds’ modest downside volatility. Sortino ratios for this year’s best-performing utility ETFs average 1.78 compared with the S&P 500’s –.06 reading. As is the case with Sharpe ratios, the higher the value for a Sortino ratio, the better. Sortino ratios are definitive metrics of “bad” volatility because they represent the standard deviation of downside risk rather than the entire risk—upside and downside—as embodied in Sharpe ratios.
In protracted downturns (think: recessions), utility stocks historically fare better than issues in other sectors. There’s an old adage in the stockbroking business that “nobody wants to take a cold shower in the dark,” meaning people cannot go without gas, water and electricity even in the depths of an economic slowdown. The buoyancy that ensues from this line of thinking limits drawdowns and allows utility funds to keep more of the gains they earn.
Moderation in inflation—reflected in the most recent consumer and producer price index numbers—may also take the Fed’s foot off the interest rate accelerator. That would be a boon to utility stocks.
Because of their price resilience, utilities offer long-term diversification benefits to a balanced portfolio. We’ve described how this effect can be measured through the diversification ratio in previous columns. The diversification benefit earned by utility funds with small-cap exposure is greater than that acquired through a large-cap portfolio.
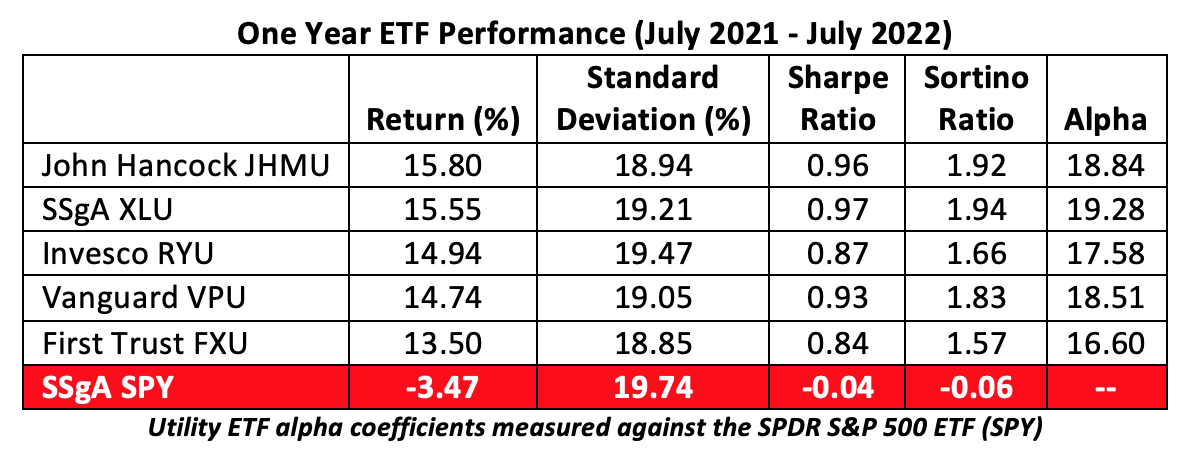
- The John Hancock Multifactor Utilities ETF (JHMU) selects constituents by market cap but employs size, value and profitability factors to modify its weightings. JHMU’s asset inflow rate was the highest of our top five funds last month despite its relatively pedestrian 2.7% return. The fund has the richest dividend yield in the table, spitting out cash at a 3% annual rate, far above its 40 basis point annual expense ratio.
- The Utilities Select Sector SPDR Fund (XLU) invests in utility companies that are included in the S&P 500. As such, it’s concentrated in a few large-cap names. Assets began leaking from the $16.7 billion fund over the past month despite its 3.5% gain. XLU costs 10 basis points a year to hold and currently pays a 2.9% annualized dividend.
- The weighting scheme of the Invesco S&P 500 Equal Weight Utilities ETF (RYU) enhances the impact of the smallest stocks and skews the portfolio away from the capitalization-weighted version of the S&P 500 utility mix represented by XLU. Over the past month the fund appreciated 3% as net inflows enhanced its asset base. RYU’s annual dividend yield is 2.9%, paired with an annual expense ratio of 40 basis points.
- The Vanguard Utilities Fund (VPU) tracks a modified all-cap index of utility companies. Subject to capping limitations, the index methodology is designed to ensure portfolio diversity by limiting the weights of individual constituents. VPU appreciated 3.6% over the past month despite experiencing a modest asset outflow. Holders of VPU can expect to earn a 2.8% dividend yield while paying a modest 10 basis point holding expense.
- Apart from its 4.1% return this month, the First Trust Utilities AlphaDEX Fund (FXU) enjoyed substantial growth in its asset base through recent inflows. Using a quant methodology to look for stocks likely to outperform the broader utilities market, the portfolio tilts heavily toward mid-cap issues. FXU pays out a 2.9% annualized dividend but costs 64 basis points to hold.
While broad-based utility funds may look very much alike on the surface, the gizmos and gadgets powering their constituent selection process yield some distinct differences, most particularly with respect to the degree of insulation from downside volatility
The table above reveals the funds’ past performance but leaves us to ponder which portfolio is likely to do best in the months to come. Over the long term, factor analysis reveals the best performing utility ETFs lean toward lower volatility, higher yields and lower constituent capitalization.
While technical analysis points to price objectives some 15% to 20% higher than today’s levels, these factors are at work as well.
As always, personal predilections dictate an investor’s choices. Let’s suppose an investor’s risk profile places a premium on downside protection and secondarily weights the potential for higher dividend yields above the upside momentum currently afforded by smaller stocks.
Using the MSCI FaCS spectrum, we might then assign a 50% weight to the low volatility factor, a 30% weight to the yield factor, leaving 20% to the small size overweight. That done, the investment decision matrix looks like this:
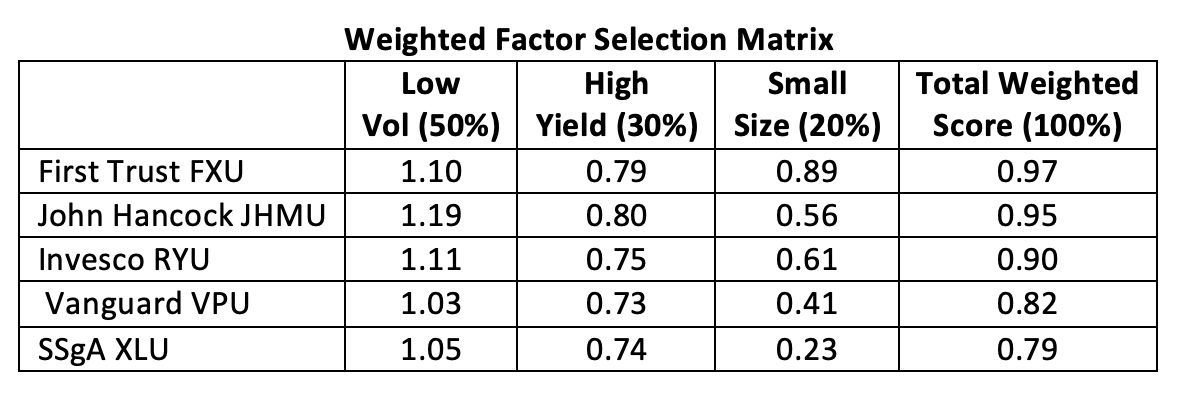
Factor strength, together with a bullish technical picture, seems to point to the First Trust Utilities AlphaDEX Fund as a solid choice going forward.
Brad Zigler is WealthManagement's alternative investments editor. Previously, he was the head of marketing, research and education for the Pacific Exchange's (now NYSE Arca) option market and the iShares complex of exchange traded funds.


