I slave mightily to educate investors and financial advisors on, among other things, technical analysis—the interpretation of market sentiment reflected in stock price patterns. Most recently, for example, I pointed to a chart pattern signaling a potential breakout in the iShares MSCI Netherlands ETF (NYSE Arca: EWN).
Now, less than three weeks later, the exchange-traded fund’s up nearly eight percent, about halfway to its predicted near-term objective.
I’m not blowing my own horn here. Technical analysis, to be sure, isn’t perfect. Success as a “technician” depends on one’s powers of perception, discernment and, as always, risk management. Chart patterns can, however, reveal market participants’ outlooks and can prove useful in forecasting future price action.
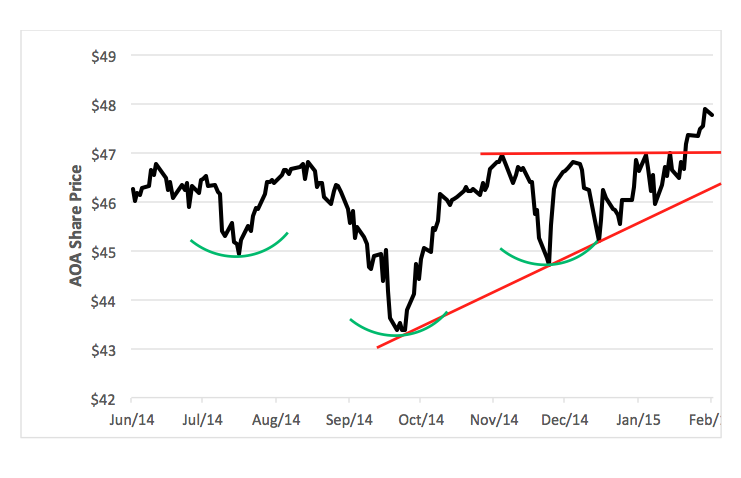
Look at the chart of the iShares Core Aggressive Allocation ETF (NYSE Arca: AOA). This fund-of-funds is the riskiest in the Blackrock suite of cheap risk-throttled ETFs. AOA allocates 80 percent of its portfolio space to equity ETFs and 20 percent to bond funds.

A couple of thoughts come to mind when I look at this chart. First of all, it seems as though investors are getting much more comfortable with the notion of risk. I think this because of the interplay of two classic technical patterns—the head-and-shoulders bottom (marked by the green ellipses) and an ascending triangle (highlighted by the red lines)—both very reliable indicators of a price bolt to the upside. I can see a $50 price objective in short order.
Not everybody’s enamored of technical analysis. In fact, a lot of investors deride it as voodoo. I can’t blame them, really. It is a bit like reading tarot cards with all the mumbo jumbo about “cups and saucers” and “pennants” and the like.
Among those in the doubting category is Scott Adams, the fellow that pens the daily Dilbert comic strip. Scott put technical analysis in its place earlier this week when he offered this:

Now how am I supposed to compete with that?
Brad Zigler is REP./WealthManagement's Alternative Investments Editor. Previously, he was the head of marketing, research and education for the Pacific Exchange's (now NYSE Arca) option market and the iShares complex of exchange traded funds.


