
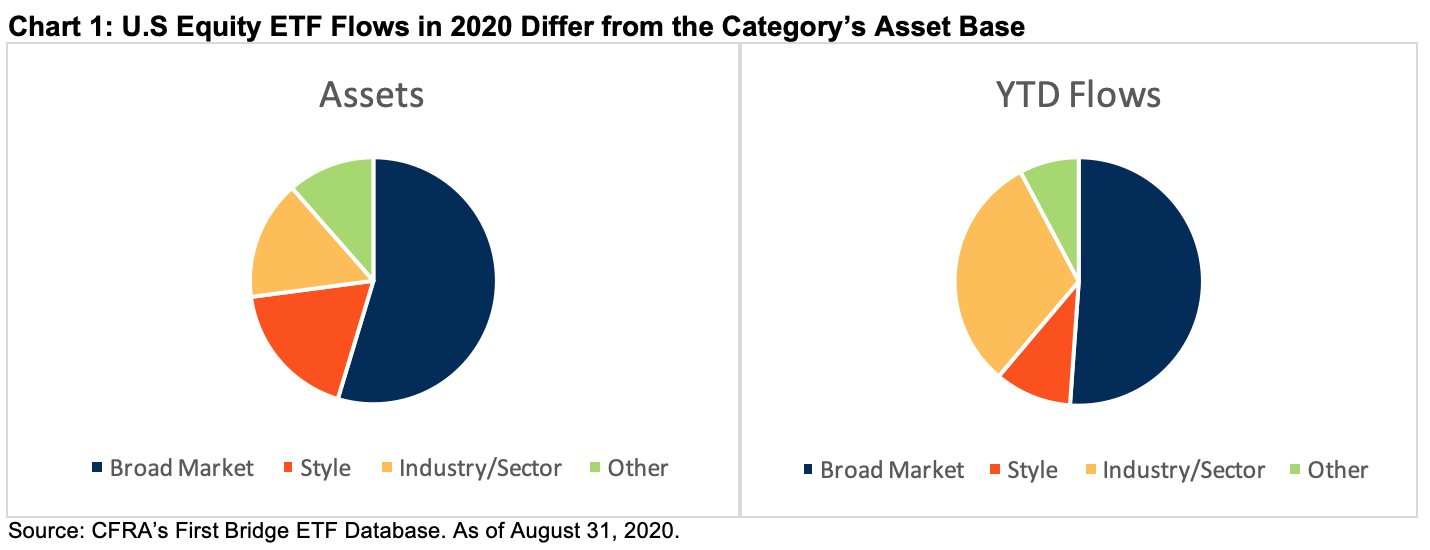
Industry/Sector funds gathered 31% of U.S. equity net ETF inflows in 2020. While U.S. equity ETFs pulled in $71 billion year to date through August, according to CFRA’s First Bridge ETF Database, just $1.6 billion of new money came in during August. The recent inflows were muted given the 7% gain for the S&P 500 in August.
Investors continued to add to broad market U.S. equity products last month, such as Vanguard Total Stock Market Index ETF (VTI) pushing the subcategory’s year-to-date inflows to $36 billion, equal to 51% of U.S. equity inflows and nearly in line with its 55% share of the category’s asset base. However, U.S. dividend and fundamental ETFs and U.S. style ETFs incurred $3.1 billion and $1.8 billion of redemptions during the month. Meanwhile, U.S. Industry/Sector ETFs pulled in $2.7 billion of new money in August to drive year-to-date inflows to $22 billion, approximately double their share of U.S. equity category assets.
Investors have used Industry/Sector ETFs in a tactical manner to ride winning growth strategies as well as to bottom fish in the value sectors that have lagged.
Energy ETFs Pulled in the Most Net Inflows Among Industry/Sector ETFs This Year
The Energy Select Sector SPDR Fund (XLE) collected $3.6 billion of new money in the first eight months of 2020, higher than ETFs providing exposure to significantly better-performing sectors. The fund, which has approximately 45% of assets in Chevron and ExxonMobil, ended August with $10 billion in assets but was hurt by a 39% loss.
XLE was far from the only sector ETF to garner investor interest despite lagging the S&P 500 Index. Utilities Select Sector SPDR Fund (XLU) and Industrials Select Sector SPDR (XLI) gathered $2.4 billion and $1.8 billion, respectively, even though the ETFs were down 6.6% and 3.3% year to date through August.
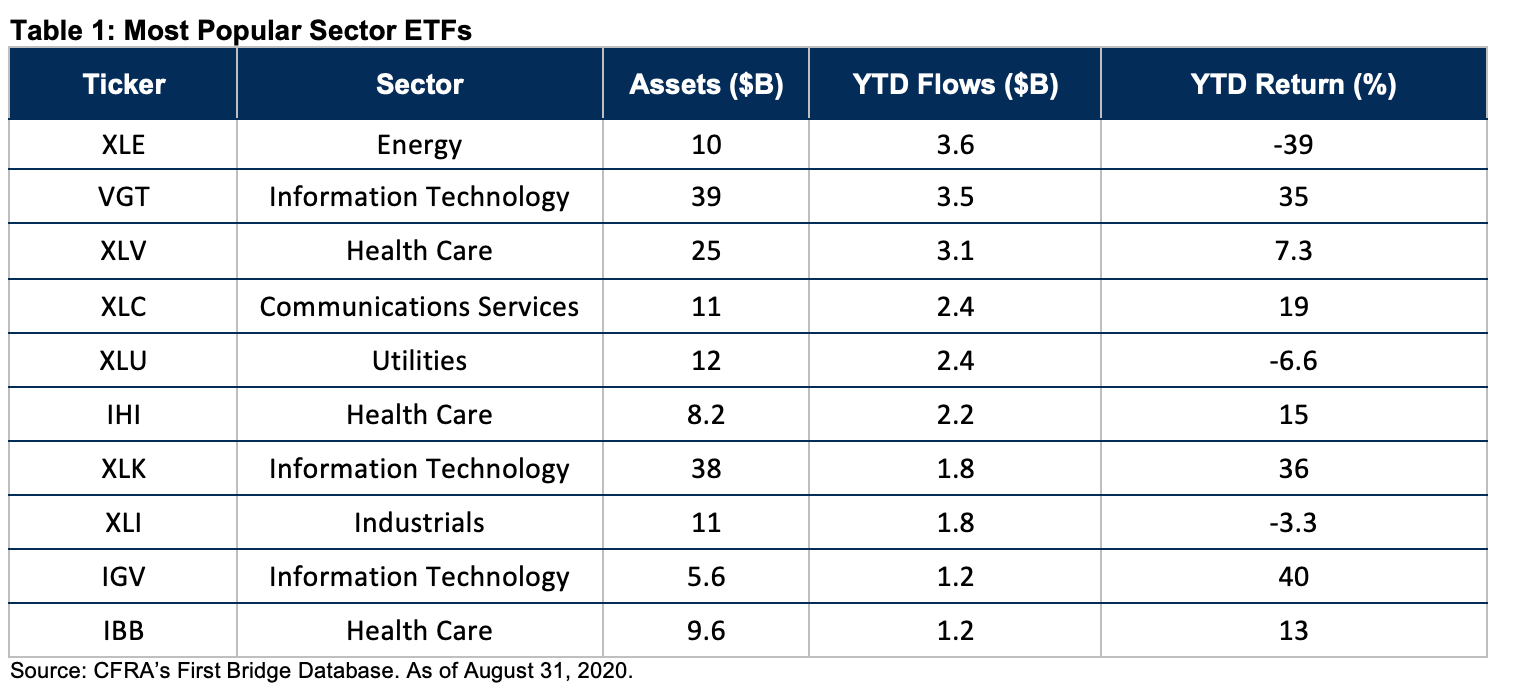
Strong-performing Technology and Health Care ETFs were in also demand. Broadly industry diversified Vanguard Information Technology Index Fund ETF Shares (VGT) and peer Technology Select Sector SPDR ETF (XLK) pulled in $3.5 billion and $1.8 billion, respectively, in the first eight months of 2020, likely aided by impressive 35% and 36% total returns and confidence that heavyweights Apple and Microsoft could climb higher. Much smaller and more narrowly focused iShares Expanded Tech-Software Sector ETF (IGV) collected $1.2 billion and rose 40% to push its asset base to $5.6 billion.
Though the Health Care sector gains could not keep up with the high returns of Information Technology in the first eight months of the year, the sector’s relative strength compared with the broader market helped some of the larger related products to be among the leading subcategory asset gatherers. Health Care Select Sector SPDR Fund (XLV), which offers exposure to pharmaceuticals, health care equipment, biotechnology and more, had $3.1 of net inflows as of August 2020, while two narrowly focused industry funds were part of the top-10 gathers among sector products. iShares U.S. Medical Devices ETF (IHI) and iShares Nasdaq Biotechnology ETF (IBB) gathered $2.2 billion and $1.2 billion, respectively. Both funds outperformed more broadly diversified XLV in 2020.
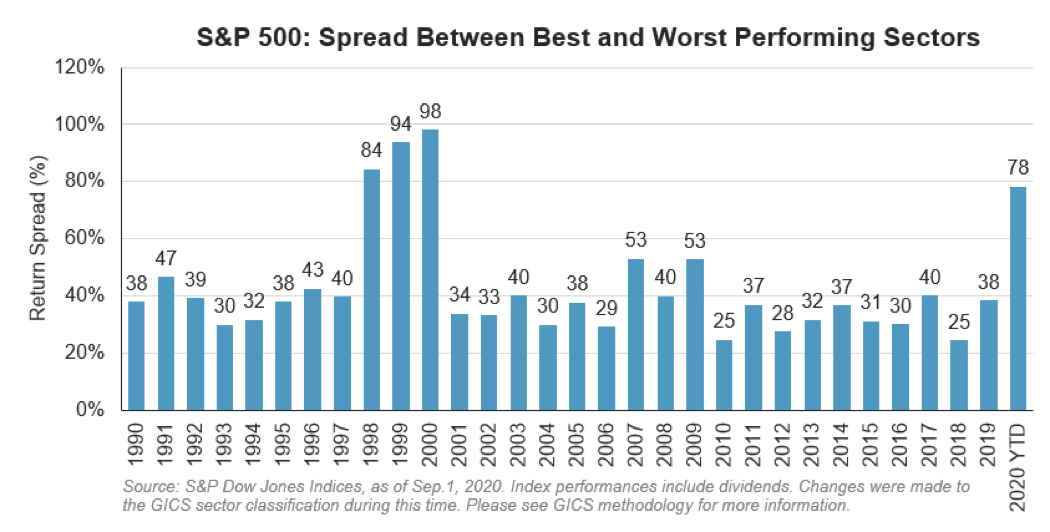
The Spread Between S&P 500 Sector Winners and Losers Is Abnormally High in 2020
As of Sept. 1, there was an approximately 7,800 basis point (78%) differential between the Information Technology and the Energy sectors year to date. According to Chris Bennett, an index investment strategist at S&P Dow Jones, if this spread holds through the end of the year, it would be the widest on a calendar-year basis in 20 years. In 1998 (84% spread), 1999 (94%) and 2000 (98%), the gaps were even wider than what investors witnessed thus far in 2020, but since then the dispersion has been much narrower. Between 2001 and 2019, the spread ranged between 25% (most recently in 2018) and 53% (most recently in 2009). This spread is still wide enough to highlight the merits of making sector over- and underweight recommendations.
Information Technology was a top-performing sector in the past. For example, in 1999, the sector rose 79% (much stronger than Consumer Staples’ 15% loss), but the next year Information Technology was the biggest laggard and fell 41% (much weaker than Utilities’ 57% gain).
However, CFRA does not believe the Tech sector will underperform as we head into 2021. Rather, we recommend investors overweight the sector, as well as Communications Services, Consumer Staples and Health Care, relative to the weighting within the S&P 500 Index. In contrast, we recommend underweighting the Energy, Financials, Real Estate and Utilities sectors. To learn more about these sector views, visit the Sectors tab on MarketScope Advisor.
Conclusion
On a top-down basis, CFRA is bullish on four S&P 500 sectors, and we think industry and sector ETFs provide investors with a targeted yet diversified approach to follow our investment strategies. While the spread between the best- and worst-performing sectors will likely narrow, there’s ample opportunity to benefit from the dispersion in the fourth quarter of 2020 and beyond. CFRA ETF ratings combine holdings-level analysis with fund attributes such as performance and costs.
Todd Rosenbluth is the director of ETF and mutual fund research at CFRA. Learn more about CFRA's ETF research here.


