
Bonds have long been considered the classic volatility hedge for portfolio builders. And now, with volatility churning at record levels and stocks skidding into a bear market, the countervailing force of bonds—especially U.S. Treasurys—seems more necessary than ever.
So what of government paper? How has an allocation to Treasurys helped tame the volatility beast?
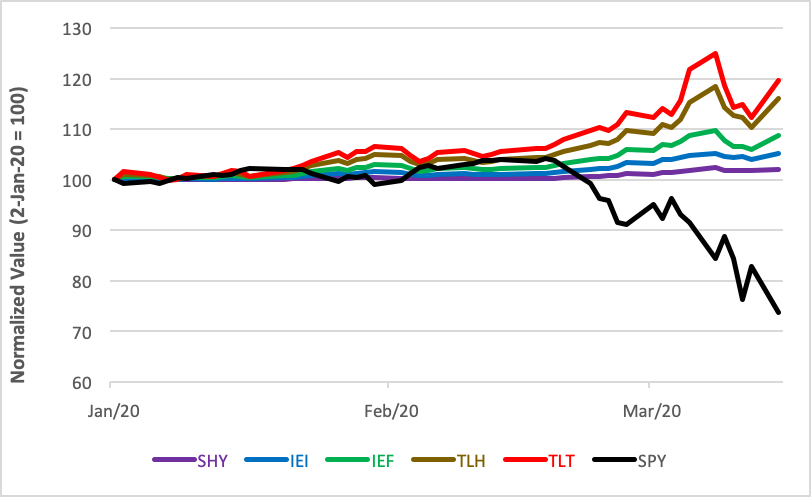
It’s been a mixed bag but that should come as no surprise. Seasoned investors know that longer-dated bonds tend to be more tempestuous than short-term paper. They know that 30-year bonds, pricewise, are going to be more reactive than 2-year notes. You can see this truism played out in the chart below where the normalized year-to-date prices of five T-bond ETFs are graphed against the SPDR S&P 500 Trust (NYSE Arca: SPY)
Year-to-Date T-Bond ETF Performance
The iShares 1-3 Year Treasury Bond ETF (Nasdaq: SHY) tracks an index of 66 issues with an average maturity of 1.89 years.
Further out on the curve are the 86 issues that make up the iShares 3-7 Year Treasury Bond ETF (Nasdaq: IEI) portfolio. IEI’s components have an average weighted maturity of 4.79 years.
With a mean maturity of 8.49 years, the 17 bonds in the iShares 7-10 Year Treasury Bond ETF (Nasdaq: IEF) portfolio anchor the intermediate segment of the Treasury spectrum.
Down the line are a dozen securities tracked by the iShares 10-20 Year Treasury Bond ETF (NYSE Arca: TLH) coming due, on average, in 17.28 years.
On the yield curve’s extreme right is the iShares 20-30 Year Treasury Bond ETF (Nasdaq: TLT), a portfolio comprising 41 bonds with an average maturity of 25.65 years.
Taking the funds’ measure
On its face, the chart makes it seem that maturity and volatility are directly related. That’s true, to a point, but a bond’s due date (or the average weighted maturity of a bond fund) falls short as a proper volatility measure. For one thing, maturity doesn’t account for differences in bond coupons. Bond-savvy investors know from experience that a 10-year note with a 3% coupon is going to be more sensitive to interest rate changes than one paying 5%. Yield to maturity also factors into a bond’s reactivity. All else held equal, a bond with a lower YTM tends to be more volatile.
In sum, a bond fund’s response to interest rate changes is an amalgam of its constituents’ competing risk factors, all of which can be boiled down into the duration metric. Duration measures how many years it takes for a bond’s price to be recouped by its internal cash flow. The longer the duration, the riskier the bond. While the math used to derive duration requires discounting, investors can readily make intuitive sense of the concept. A bond that pays off in five years is easily seen as less risky than an obligation with a payback date 10 years out. Mathematically, though, duration and maturity aren’t equal. The duration of a “vanilla bond” will always be shorter than its maturity.
Duration can be used, to a limited degree, as a predictive tool. Commonly, duration is used to explain the change in a security’s value expected to result from a 1% shift in interest rates. Multiplying a bond's duration by the shift in the relevant interest rate, in percentage points, yields a rough approximation of the expected change in the bond's value. Thus, a note with a 4.5-year duration can be predicted to decline in value 4.5% if interest rates climb by 100 basis points.
For vanilla bonds, longer maturities and smaller coupons tend to lengthen duration; shorter maturities and higher coupons generally compress duration.
Duration doesn't describe the entirety of a bond's behavior, however. For large declines in yields, the duration calculation tends to underestimate price increases, while overestimating price declines when interest rates spike precipitously. Another derivative, known as convexity, measures the error in the duration prediction. Positive convexity, a trait common to all of the Treasury bond ETFs, implies lengthening duration as rates fall and contraction when rates rise.
Convexity, like duration, is used to compare the relative risks associated with bonds. A more convex bond will be less affected by interest rates if it competes against another obligation offering the same duration and yield. Therefore, in an environment where greater rate volatility is expected, bond traders pay greater deference to convexity.
Bonds with greater convexity will typically command higher prices than less convex bonds, whether interest rates rise or fall. That gives them a certain resiliency. Investors expect to pay more money, or accept a lower yield to maturity, for a high-convexity bond versus a low-convexity security. Lower coupon securities, too, are comparatively more convex.
So, what’s the takeaway?
Just this: It’s clear that the long bond-dominated TLT portfolio has been the yin to the stock market’s yang. For the past year, in fact, TLT’s standard deviation has been higher than SPY’s. Fortunately, TLT’s negative correlation to stocks has made that volatility an effective offset to equity market weakness.
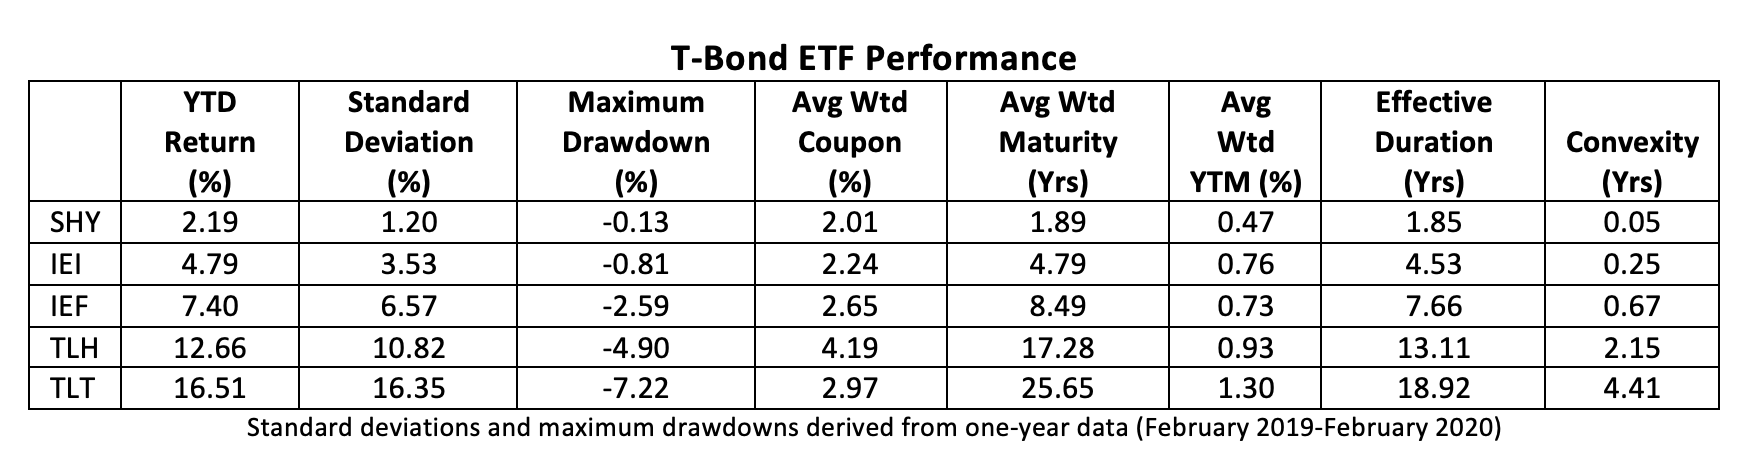
With a convexity of 4.41 years, the TLT portfolio is likely to be exquisitely more sensitive to extreme changes in prevailing rates, more sensitive than its duration would predict. Just how sensitive may be a surprise to unwary fund investors.
Brad Zigler is WealthManagement's alternative investments editor. Previously, he was the head of marketing, research and education for the Pacific Exchange's (now NYSE Arca) option market and the iShares complex of exchange traded funds.


