
iShares has the most ETF assets in mid-cap strategies. The division of BlackRock was the ETF industry’s leader for equity ETFs as of August, according to CFRA’s First Bridge ETF data. The firm’s $1.3 trillion in assets was equal to a 35% share of the market, higher than Vanguard’s $1 trillion (29%) and State Street Global Advisors $613 million (17%). However, iShares’ recent $104 billion in mid-cap ETFs was a whopping 53% share of the investment style, well above the assets managed by Vanguard (28% share) and State Street (10%).
Chart 1: Mid-Cap ETF Market Share by Asset Manager
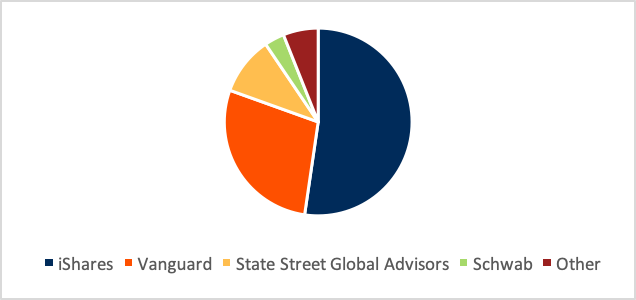
CFRA’s First Bridge ETF Database. As of August 31, 2020
The S&P Dow Jones Indices has been the leading index provider of mid-cap strategies but faces competition. At the end of August, the division of S&P Global was behind 41% of equity ETF assets, a higher share than MSCI (17%), FTSE Russell (16%) and CRSP (12%). For mid-caps, with $91 billion in ETF assets tied to their benchmarks, SPDJI had a slightly higher 46% share of the market, with CRSP (27%) and FTSE Russell (23%) fighting hard for the second spot, as MSCI’s presence in the investment style was negligible.
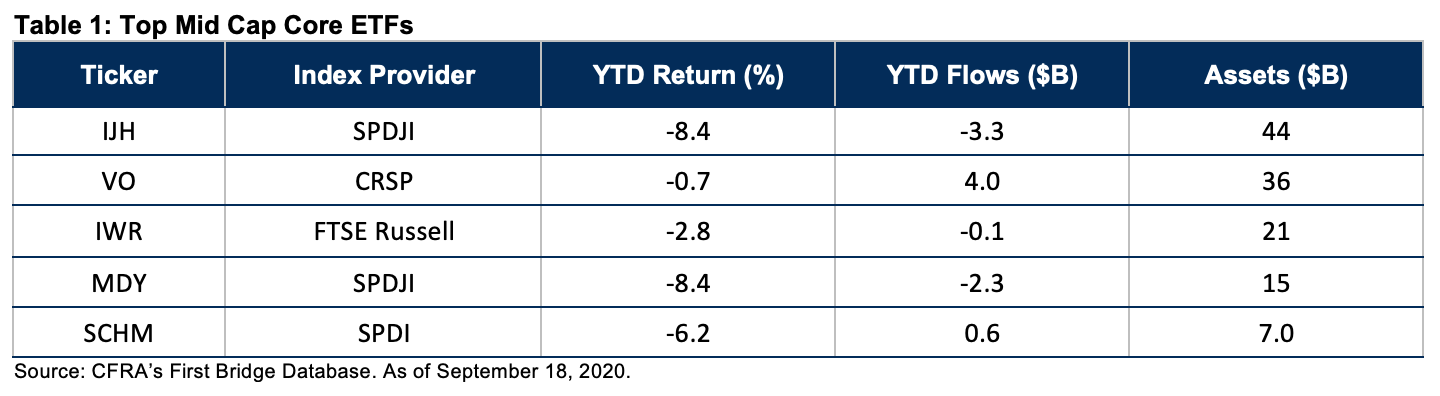
While iShares and S&P Dow Jones Indices are the top mid-cap based firms, Vanguard’s CRSP fund has been gaining share. Through the $44 billion iShares Core S&P Mid-Cap ETF (IJH) and $21 billion iShares Russell Mid-Cap ETF (IWR), BlackRock offers two of the three mid-cap ETFs with the most assets. However, the $36 billion Vanguard Mid-Cap Index Fund ETF (VO) has been the most popular of these mid-cap strategies in 2020, gathering $4 billion of net inflows even as IJH and IWR incurred net outflows.
Chart 2: Mid Cap ETF Index Tracking Market Share

Source: CFRA’s First Bridge ETF Database. As of August 31, 2020
VO has the lowest expense ratio of the three but is likely also being helped by the fund’s stronger performance. Year-to-date through Sept. 18, VO was down just 0.7%, comparing favorably to the 2.8% and 8.4% losses incurred by IWR and IJH, respectively. On a three-year annualized total return basis, VO’s 8.0% was more modestly ahead of IWR’s 7.2%, but was far ahead of IJH’s 3.6% gain.
Do not rely solely on past performance with ETFs. CFRA encourages investors to go beyond the records of ETFs and look inside the portfolio. With style ETFs, this can be particularly important since each index provider uses different security inclusion criteria and often includes distinct companies in the benchmark, resulting in unique passively managed ETF portfolios.
For example, VO had a median market capitalization of $20 billion at the end of August, much higher than $3.9 billion for peer IJH. The largest companies in VO at the end of August, included Digital Realty Trust and Lululemon Athletica, both at about a $38 billion market cap. In contrast, IJR’s top positions were FactSet Research Systems and Fair Isaac, which have market capitalizations of $13 billion that would put them in the lower half of VO. From a sector perspective, VO has more exposure to Information Technology and Communications Services companies than IJH, but less exposure to Consumer Discretionary and Financials.
Both ETFs earn CFRA four-star ratings combining risk, reward and cost factors, including a proprietary review of the fund holdings. In contrast, IWR earns a two-star rating as we think the ETF has lower reward potential.
Conclusion
The S&P Mid-Cap 400 Index is expected to generate earnings per share growth of 42% in 2021, faster than the 27% for the S&P 500 Index. While CFRA thinks there are strong mid-cap products to choose from it is helpful to understand the asset managers and the index providers behind them.
Todd Rosenbluth is the director of ETF and mutual fund research at CFRA. Learn more about CFRA's ETF research here.


