
This is gonna be one of those “good news, bad news” columns. The good news is that the stock market is now poised to challenge the record high it set back in September. And the bad news? The bad news is that the stock market is poised to challenge its record high.
Confused? Just look at the chart below. See the green rectangle? It projects a congestion area in the normalized price of the SPDR S&P 500 ETF (NYSE Arca: SPY) that would be formed once the fund regains its fall summit at the $293 level. If the fund regains the summit. That’s where the question mark comes in. If the market rises to test the old high and then fails, that’s bad. If, on the other hand, a new high is made, that’s good. Very good. Good as in a further 20% run to the upside.
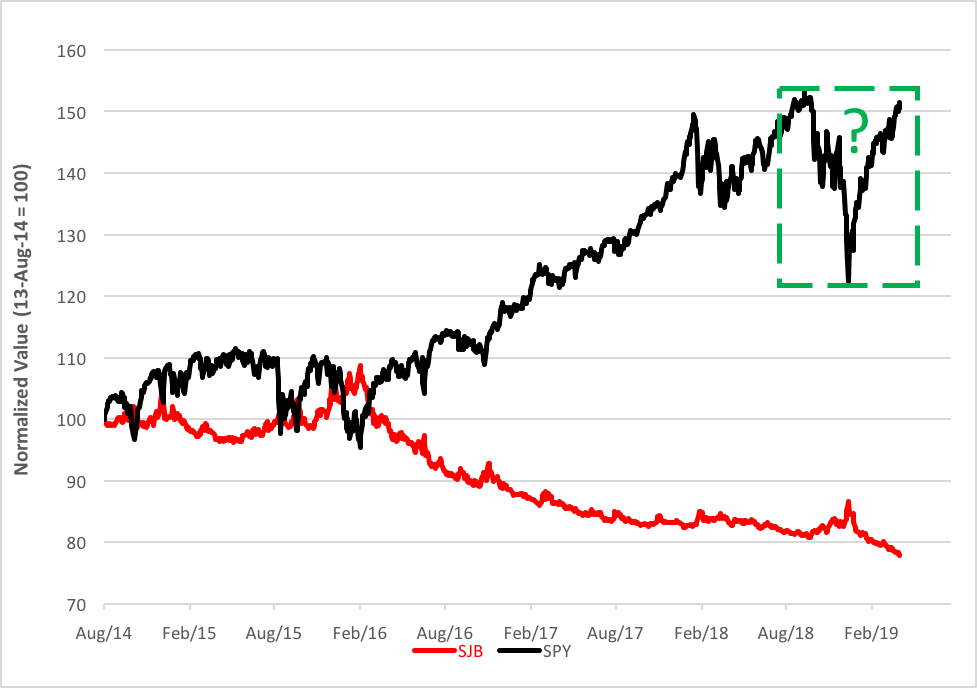
There’s a compelling case for a bullish breakthrough made by the chart’s red line that tracks the normalized price of the ProShares Short High Yield ETF (NYSE Arca: SJB). SJB provides unlevered inverse (-1x) exposure to the Markit iBoxx $ Liquid Yield Index, a market-weighted index of corporate high-yield bonds with maturities between 3 and 15 years. Buying SJB is a bet against junk bonds. SJB rises when junk is, well, junk. SJB declines when low-grade debt fares well.
There’s a relationship between SJB’s price and that of SPY. You might say that SJB is, in fact, a leading indicator of SPY’s trajectory. Junk bonds and the common stocks tracked by SPY have low-priority claims on corporate earnings and liquidation proceeds. Junk bonds, though, are more exquisitely sensitive to wobbles on corporate balance sheets and income statements and are first movers. It makes sense that the junk market would be more reactive than stocks. That’s why stock traders keep a keen eye on junk debt for “tells.”
A while back, HYG broke through a double bottom, which set up its current decline to the $21 level. Another 5% decline in SJB’s price puts a new bearish objective in play. And, by extrapolation, lends a more bullish glow to the stock market.
So, if you’re looking for a reason to adjust your equity exposure, keep your eye on that squiggly red line.
Brad Zigler is WealthManagement's alternative investments editor. Previously, he was the head of marketing, research and education for the Pacific Exchange's (now NYSE Arca) option market and the iShares complex of exchange traded funds.


