
Several long-only commodity exchange traded products signaled bottoming action ahead of the September Federal Open Market Committee meeting. Such technical uniformity is significant, given the diverse index methodologies and track records.
Oh, I hear your doubt: “Commodities? Really? With inflation barely readable?”
It’s true that inflation has been sluggish, but there are signs of that latency giving way. The slack in the labor market, according to Fed chair Janet Yellen, has largely disappeared and is gradually pushing up wage and price growth.
And then there’s the inflation surprises, most particularly in the Eurozone. Inflation in the zone has beat economists’ expectations in the past 12 monthly reports. Indeed, the upswing in global economies helped spur the Fed to crank up domestic rates earlier this year. How soon before we see consistent inflation surprises on this side of The Pond?
Investors assume a direct correlation between commodity prices and inflation. But research shows that only certain commodities, not commodities in general, have a significant impact on inflation as measured by the Consumer Price Index. When the Bureau of Labor Statistics analyzed price movements in four commodities—crops, animal slaughter and processing, dairy, and oil and gas—only the petroleum products substantially contributed to inflation.
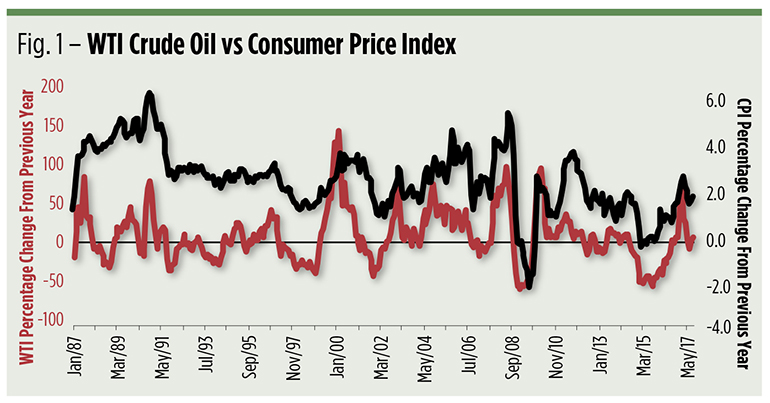
Figure 1 portrays the correlation between changes in the CPI inflation rate and prices for West Texas Intermediate crude oil. Since 1987, the correlation is 52 percent, four times higher than the coefficient for gold—the commodity most commonly touted as an inflation hedge. Over the past five years, oil’s correlation to CPI is even tighter—87 percent. Put into another statistical context, three-quarters of CPI’s movements can be explained by oil. For gold, the explanation rate, known as the R2 coefficient, is a mere 3 percent.
So, if you’re banking on inflation to drive the price of your commodity index product, you’re better off—all else held equal—finding the one in which oil has the greatest influence. It’s worth a look at the exchange traded commodity index funds with the longest track records to see how they’ve tracked inflation. (We’re going to ignore a couple of commodity index exchange traded notes because their carried credit risk can influence pricing.)
Each commodity ETF tracks an index that’s a unique combination of a weighting scheme and a roll methodology. A “roll” is the lingo that describes the simultaneous sale of a soon-to-expire futures contract and the purchase of a longer-term replacement delivery. It’s done to maintain continuous exposure to the commodity. Rolling comes with a cost because the price of the expiring contract typically differs from the price of the more distant future.
In a normal market for a storable commodity, the price of the distant delivery will be higher than that of the nearby contract. The difference, known as “contango,” reflects the cost of storage and insurance mostly. If, for example, November crude oil is trading at $50 per barrel while the contract calling for delivery the following February changes hands at $52, there’s a $2 contango or cost of carry. Now, imagine rolling a long position from November to February. You’d sell November for $50 and buy February at $52 for a $2 roll cost. If the roll cost exceeds any appreciation above November’s original cost base, or if the sale price is below the cost base, a loss is realized. A gain is booked when appreciation in the November contract exceeds the roll cost. From this, you can see why contango is a long-only commodity index fund’s bugaboo.
In order of longevity, the five most seasoned commodity index ETFs are:
- PowerShares DB Commodity Index Tracking Fund (NYSE Arca: DBA): This ETF tracks the DBIQ Optimum Yield Diversified Commodity Index Excess Return, a hybrid production-based benchmark of 14 commodity futures. More than half of the ETF’s commodity exposure is to the energy sector with crude oil, split evenly between West Texas Intermediate grade and the heavier Brent grade, making up 25 percent of the fund’s total weighting. The fund’s index methodology attempts to optimize rolls by selecting the delivery month over a 13-month horizon with the least contango impact.
- iShares S&P GSCI Commodity-Indexed Trust (NYSE Arca: GSG): A production-weighted “vanilla” index, the former S&P Goldman Sachs Commodity Index, underlies this ETF, but instead of being built on a portfolio of individual commodity futures, it holds a single long-dated position on the GSCI futures. GSG’s composition is weighted at 56 percent to the energy sector, and because of liquidity constraints, is tilted heavily toward crude oil. Oil accounts for 53 percent of GSG’s total heft now.
- WisdomTree Continuous Commodity Index Fund (NYSE Arca: GCC): Based on the Thomson Reuters Equal Weight Continuous Commodity Total Return Index, this 17-commodity tracker underweights oil, at least compared to the production-weighted ETFs. The fund’s exposure to the energy complex is just 12 percent, with crude oil accounting for half that weight. Rather than holding just the front month contract, GCC “averages” its position in each commodity over the nearest six deliveries in an attempt to minimize contango drag.
- United States Commodity Index Fund (NYSE Arca: USCI): This fund’s underlying index, the SummerHaven Dynamic Commodity Index Total Return, is an equal-weighted benchmark of 14 commodities. To manage contango, the index methodology calls for a monthly rebalancing in which seven commodities with the least contango, and another seven with the greatest 12-month price momentum, are selected for purchase, with the proviso that the portfolio holds at least one precious metal, one industrial metal, one energy, one livestock, one soft commodity and one grain contract. Accordingly, the portfolio’s exposure to crude oil can vary considerably over time. Presently, crude oil’s allocation is 14 percent.
- iShares Commodity Optimized Trust (NYSE Arca: CMDT): Taking a multifactor approach to a 20-commodity basket, CMDT’s underlying index, the Bloomberg Roll Select Commodity Total Return Index, selects contracts with the least contango while weighting allocations on the basis of production, liquidity, diversification and continuity. CMDT’s portfolio holds a single position in a futures contract based on the Bloomberg index. Within the index, energy weighs in at 29 percent and crude oil accounts for roughly half of that.
If we look at the track record of these five ETFs over the past three years (see Table 1), we can readily see crude oil’s influence. As crude oil prices tumble, the fund with the largest exposure, GSG, fell apace. Note that GSG’s R2 coefficient is 91.66, meaning that nearly 92 percent of GSG’s price movements can be explained by gyrations in oil’s cost. In this time span, most of that gyration was downward.
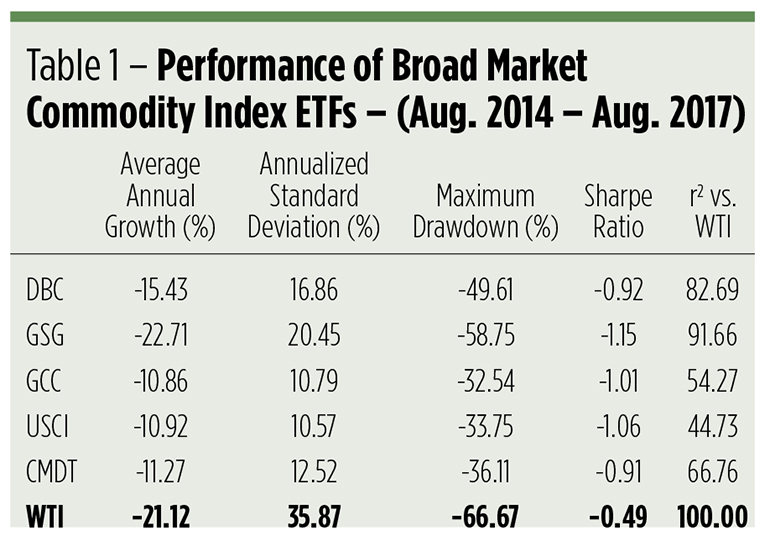
The question to ask now is what happens when oil’s prices rise? Are these ETFs likely to be driven by oil then? If so, by what degree?
When looking for historical precedent, we’re up against the commodity ETFs’ relatively short track records. Worse still, oil’s been on the skids since the 2008 financial crisis. GSG and DBC are the only ETFs that predate the Great Recession; both were launched in 2006. Luckily, oil was charging upward when these two funds debuted, so we can trace their relationship to WTI over a 23-month period bull run.
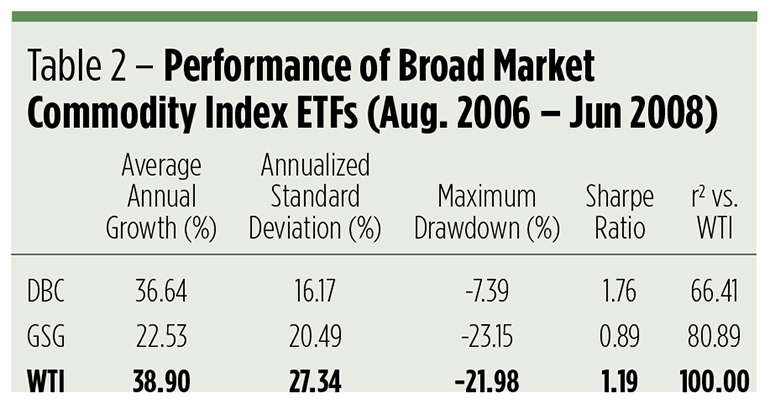
In Table 2, you can once again see GSG’s R2 coefficient is higher than that of DBC. Despite this, the iShares fund’s returns are significantly less than crude oil’s. That’s the contango effect in action. The optimization process built into the DBC portfolio minimized negative roll yields and may, too, have better exploited the 10-month backwardation that developed in the WTI market in mid-2007.
Backwardation is the opposite of contango. That is, deferred deliveries become cheaper than nearbys in an inverted market. For example, if March crude sells for $142 per barrel when April’s at $140, rolling a long position forward, selling March and buying April, produces an incremental gain of $2. Backwardation is a tailwind for long-only commodity funds. Contango’s a headwind.
Why would a market invert like that? For a storable commodity like oil, backwardation typically reflects shortage. In an inverted market, there’s so little supply that there isn’t any to carry forward for future delivery. Everyone wants their oil immediately and they’re willing to bid up its price to get it. Between August 2006 and June 2008, the WTI market spent 197 trading days, or about 39 percent of the time, in backwardation. DBC was designed to make the best of the futures curve—finding the most backwardation and the least contango—while GSG is limited to simply rolling forward its front month contracts to the next sequential delivery.
So why not just buy an oil ETF and forget about the other commodities? The answer’s found in the standard deviation, or volatility, values in the tables. Table 2. See the volatility (standard deviation) value for WTI? It’s higher than that of the broad market ETFs. Higher still is the volatility of the eldest oil ETF, the United States Oil Fund (NYSE Arca: USO). Greater volatility generally leads to deeper drawdowns.
Now, it may seem a little early to think of inflation, but when you consider oil’s correlation to the CPI and the fact that WTI’s momentum has turned upward—evidenced by a recent bullish crossover of its 13-week exponential moving average over the 39-week—you can see why savvy investors are doing their homework now so that they’re ready to place a proper hedge when things really heat up.


