
With more than $600 billion in U.S.-listed ETF assets tied to it, and hundreds of billions more in mutual fund wrappers, the market-cap-weighted S&P 500 Index continues to be the benchmark of choice for fund investors who favor a low-cost, passive approach to large caps.
However, subsets of the “500” offered by nearly a dozen ETF providers have gained in popularity as well, including "smart-beta" versions, as well as those filtered through an environmental, social and governance (ESG) lens. While many smart-beta-focused S&P 500 ETFs, such as Invesco S&P 500 Low Volatility (SPLV) and ProShares S&P 500 Dividend Aristocrats (NOBL) have been around for years, ESG classified ETFs are still gaining traction. But we think they warrant scrutiny to understand what’s inside.
Unlike SPDR S&P 500 (SPY), the largest of the cap-weighted “500” index ETFs, SPLV and NOBL start with the parent index and then select the stocks that meet their criteria. SPLV focuses on the 100 stocks with the lowest levels of volatility on a quarterly basis, while NOBL holds 58 companies that have raised their dividend for 25 consecutive years and reconstitute it quarterly.
The ESG-filtered ETFs take a similar approach, but the selection criteria are based on where the constituents score on certain nonfinancial factors pertaining to ESG risks. SPDR S&P 500 Fossil Fuel Reserves Free (SPYX) launched in December 2015 and has $410 million in assets. SPYX will likely appeal to climate-change-conscious investors by eliminating companies that own fossil fuel reserves from the S&P 500 Index. SPYX owns 487 securities from the parent index, and its weightings differ ever so slightly. Energy (1.3% of assets) is underweighted relative to SPY (4.5%), while large sectors such as Information Technology (23% vs. 22%) and Financials (14% vs. 13%) appear overweighted primarily due to rounding. Chevron (CVX) and Exxon Mobil (XOM) are not in SPYX, but oil and gas refining and marketing company Phillips 66 (PSX) is.
Global X S&P 500 Catholic Values (CATH) came to market in April 2016 and has $280 million in assets. CATH excludes companies that are involved in activities that are perceived to be inconsistent with Catholic values as set out by the U.S. Conference of Catholic Bishops. This includes contraception, stem cell research and certain weapons sales. At each quarterly rebalance, CATH retains the sector weights of the S&P 500 by redistributing the weight of each excluded stock to the other stocks within the same GICS sector.
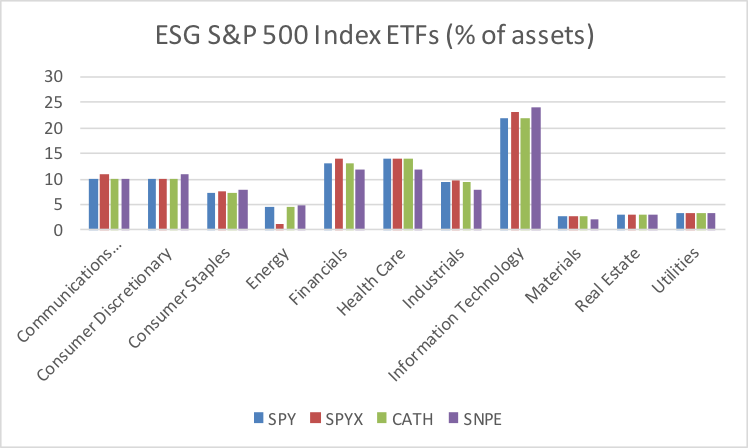
While CATH does not own Boeing (BA) or Johnson & Johnson (JNJ), the fund’s 10% stake in Industrials and 14% stake in Health Care was in line with SPY. CATH holds 461 companies.
A third ESG ETF tied to the S&P 500 Index is Xtrackers S&P 500 ESG (SNPE). The ETF launched in June 2019 and already has $100 million in assets. While SNPE excludes certain types of companies—tied to tobacco or conventional weapons for example—the ETF is more inclusionary focused than CATH or SPYX. SPNE holds 321 companies that have a sufficiently high ESG score within their GICS industry group, though the underlying index is market cap weighted, targeting 75% of the S&P 500 Index’s market cap.
Some companies that do not make the cut, such as Facebook (FB) or Wells Fargo (WFC), do so because others score higher based on ESG metrics, which can result in some stock-specific weighting differences. For example, while SNPE’s recent weighting in Financials was comparable to SPY, its 2.1% stake in JPMorgan (JPM) was higher than SPY’s 1.6%. Within Communication Services, SNPE’s position in AT&T (T) was also larger (1.5% vs. 1.1%).
Yet, in all three ETF examples, the sector weightings were largely the same as with what investors would expect with the market-cap-weighted S&P 500 Index. Not surprisingly there’s similarity in the recent track record of SPYX and CATH relative to SPY. On a three-year annualized basis ended November 5, SPYX’s 16.5% total return was slightly stronger than SPY’s 16.0% and CATH’s 15.8%; SNPE does not have a sufficiently long record but its index so far has largely been in line with the S&P 500 Index.
From a cost perspective, SNPE’s 0.11% net expense ratio is only a slight premium to SPY’s 0.09%, while SPYX and CATH charge 0.20% and 0.29%, respectfully. For investors who want broad S&P 500 exposure, but tailored to somewhat narrow or broad ESG criteria, these three ETFs are worth a look.
Given the growing interest in ESG investing and the prominence of the “500,” we would expect the combined $800 million in assets of these funds to climb much higher in the coming years.
Todd Rosenbluth is the director of ETF and mutual fund research at CFRA. Learn more about CFRA's ETF research here.


