
Among all the buzzwords and jargon tossed about by financial professionals, the adjectival terms “risk-on” and “risk-off” sure get a lot of play. CNBC pundits regularly declare this or that to be a “risk-on day” or a “risk-off day.” Trouble is, they rarely, if ever, give a definition of the term. Just when is the risk switch thrown? How do we know what kind of day it is?
Typically, the risk-on/risk-off dyad is used to describe changes in investment behavior. Risk perceptions steer capital flows. Investors, the encyclopedians tell us, flock to risky investments when, um, risk is, er, low.
Howzat?
Look, here’s a quick way to view the ole’ risk switcheroo. No need for complex math or subscriptions to expensive analytics packages. Simply divide the price of one exchange-traded fund (ETF) by another. Specifically, take the ratio of the PowerShares S&P 500 Low Volatility Portfolio (NYSE Arca: SPLV) to the PowerShares S&P 500 High Beta Portfolio (NYSE Arca: SPHB).
So, what does the ratio tell you? An upward (positive) trajectory in the ratio corresponds to “risk off” days; a slump (negative movement) means “risk on.” Simple, no?
The rationale for the ratio is simple, too. SPLV is composed of the S&P 500’s least volatile stocks while the SPHB portfolio contains the benchmark’s most market-sensitive issues. You want market risk? Buy SPHB. Want dampened volatility? SPLV’s your man.
So here’s the risk picture now…
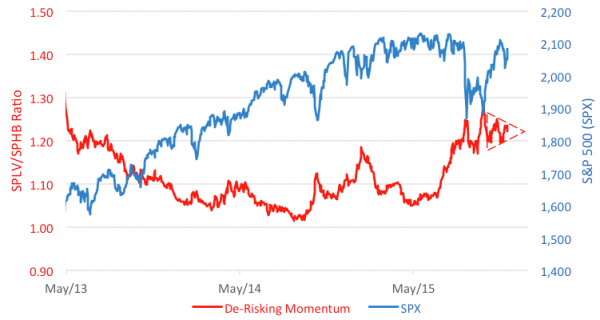
See the inverse relationship of the ratio to the S&P 500 that prevailed over the past two years? Exuberance for stocks was stoked by a “risk on” environment. But then, early this summer, when stocks leveled off, the ratio turned up in the “risk off” direction. That signaled a shift in sentiment ahead of the August selloff.
Now there’s a new pattern emerging. Ratio readings are congesting into a symmetrical triangle, a configuration that typically presages big breakout moves. The question to be addressed is this: In which direction, “risk on” or “risk off,” will the ratio break?
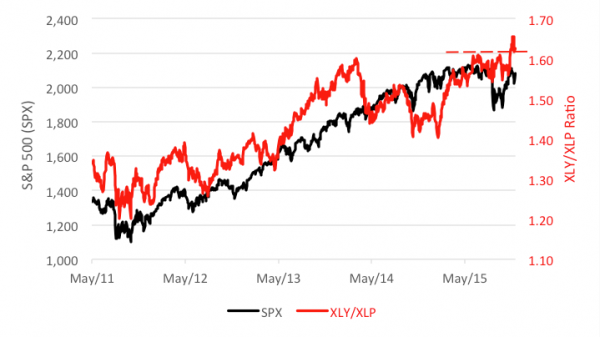
For a clue, look to another ETF ratio – that of the Consumer Discretionary Select Sector SPDR (NYSE Arca: XLY) over the Consumer Staples Select Sector SPDR (NYSE Arca: XLP). XLY tends to rise over XLP when consumers feel flush. You know, more willing to spend money on non-essentials like movies and restaurant meals. The ratio’s broken out in XLY’s favor recently and now faces a test of its former resistance level.
As long as the ratio holds above 1.60, investors think it’s “risk on.”
Brad Zigler is REP./WealthManagement's Alternative Investments Editor. Previously, he was the head of marketing, research and education for the Pacific Exchange's (now NYSE Arca) option market and the iShares complex of exchange traded funds.


