
More than a third of the way through 2018, investors have poured $93 billion into ETFs. Many of the well-known and well-diversified core funds have swelled even larger, as advisors and investors use them to implement their allocation strategies. But this year, notably, some factor-driven and sector-focused funds have also broken through the league leader board.
The two most popular ETFs to start 2018 were iShares Core MSCI EAFE (IEFA) and iShares Core MSCI Emerging Markets (IEMG). The two diversified international ETFs gathered a combined $24 billion year-to-date through May 7 and now have $110 billion in assets combined. Schwab International Equity (SCHF) also benefitted from demand for developed international equity ETFs with net inflows of $1.8 billion. Investors, however, also put money into some U.S. large-cap funds, as $4.7 billion flowed into the now $88 billion Vanguard S&P 500 (VOO 245 Overweight).
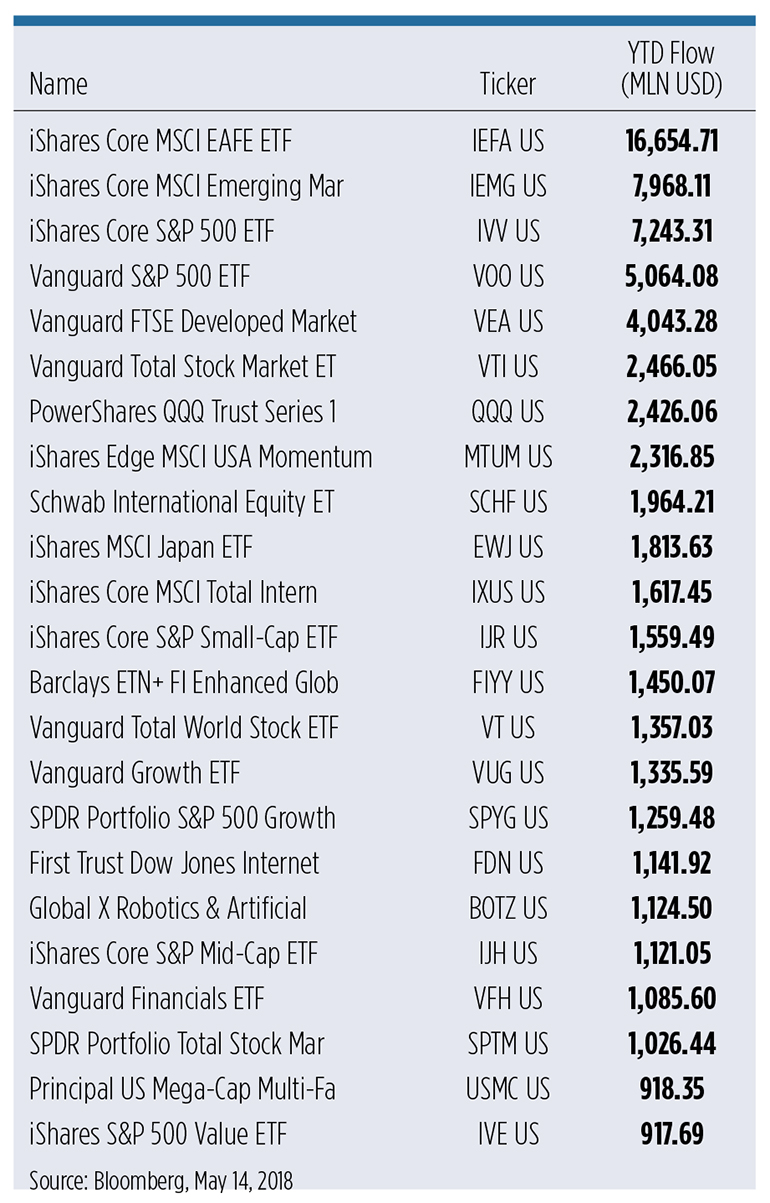
Those core allocations might be expected to gain substantial assets. But more niche ETFs are also proving they can gain traction. iShares Edge MSCI USA Momentum Factor (MTUM), Global X Robotics (BOTZ) and Vanguard Financials Index ETF (VFH) were also on the list of 21 equity ETFs with $1 billion or more of year-to-date net inflows (see table below.)
Part of the iShares Factor series that launched in 2013, MTUM holds stocks exhibiting relatively high price momentum. It’s essentially a “let your winners run” approach based on academic research. Technology (37 percent of assets), financials (20 percent) and consumer discretionary (16 percent) stocks comprise most of the current portfolio, but the ETF is rebalanced semi-annually. CFRA Buy recommended Amazon.com, JPMorgan Chase and Intel are all top-10 holdings.
The $2.2 billion of net inflows—along with a 5.4 percent return year-to-date through May 7—expanded MTUM to a $7.8 billion asset base. In contrast, the $4.8 billion iShares Edge MSCI USA Quality Factor (QUAL) and the $3.4 billion iShares Edge MSCI USA Value Factor (VLUE) added just $416 million and $243 million, respectively. For MTUM investors, the trend seems to be their friend.
Meanwhile, The Global X Robotics & Artificial Intelligence ETF (BOTZ) is a more narrowly focused thematic ETF focused on companies working on the development and production of robotics and artificial intelligence. The ETF consists of industrials (47 percent of assets), technology (40 percent) and health care (13 percent) stocks including Intuitive Surgical and NVIDIA. More than 70 percent is in companies based outside of the United States.
Even though BOTZ launched in September 2016, investors are not waiting till it hits a three-year anniversary to invest, nor is CFRA waiting to rate the fund. Thus far this year, $1.1 billion flowed in to BOTZ, which now has $2.5 billion in assets. We think the asset gathering success stems in part due to BOTZ’s 58 percent gain in 2017, even as it has lost 2.0 percent in 2018.
BOTZ is not the only robotics-related ETF available, but it’s the most successful in recently gathering assets. Indeed, ROBO Global Robotics and Automation ETF (ROBO) has $2.2 billion, but the more expensive and weaker-performing ETF only pulled in $317 million this year, far less than BOTZ. The performance difference between BOTZ and ROBO stems from the holdings distinctions; ROBO has more U.S. exposure and less in industrials companies.
While MTUM and BOTZ are relatively new success stories in the ETF world, Vanguard Financials Index ETF (VFH) has been around for 14 years. Yet the $1.1 billion net inflow to start 2018 has pushed the ETF past the $8 billion asset mark. VFH has lagged the S&P 500 Index to start 2018, but CFRA’s Investment Policy Committee favors overweighting the U.S. financials sector on expectations the group will likely benefit from improving loan growth, a steady pace of interest rate increases and deregulation.
VFH’s largest industry exposure is to banks (45 percent of assets) and insurance (19 percent) companies such as JPMorgan and Berkshire Hathaway. Such exposure is similar to what investors will find the Financial Select Sector SPDR (XLF), a $32 billion peer of VFH. However, investors pulled approximately $300 million out of XLF so far this year. While the Vanguard offering has a lower expense ratio and trades for an equal penny bid/ask spread, the Sector SPDR trades 54 million shares on average daily, 10 times as frequently during the day, which may appeal more to institutional investors.
In rating approximately 1,400 ETFs, CFRA combines holdings-level analysis with fund attributes such as expense ratio and trading costs. While we don’t think investors should chase where the “hot money” is flowing or the top performers, there’s a benefit to understanding the drivers of investor interest and determining if there’s an opportunity to build a position in such ETFs.
Todd Rosenbluth is the director of ETF and mutual fund research at CFRA. Learn more about CFRA’s ETF research here.


