
I’m no New Testament scholar, but at least I’m familiar with the passage in the book of Matthew that declares “the last shall be first, and the first last.”
If ever an assertion could be made to describe the state of large-cap strategy ETFs now, it would be just that. In July, low volatility performed best and high volatility (okay, technically high beta) performed the worst.
How so? The Invesco S&P 500 Low Volatility ETF (SPLV) notched a 3.53% gain for the month while its stablemate, the Invesco S&P 500 High Beta ETF (SPHB), lost 3.69%. Still, the high-beta portfolio’s 12-month return of 76.48% makes it the category’s best performer.
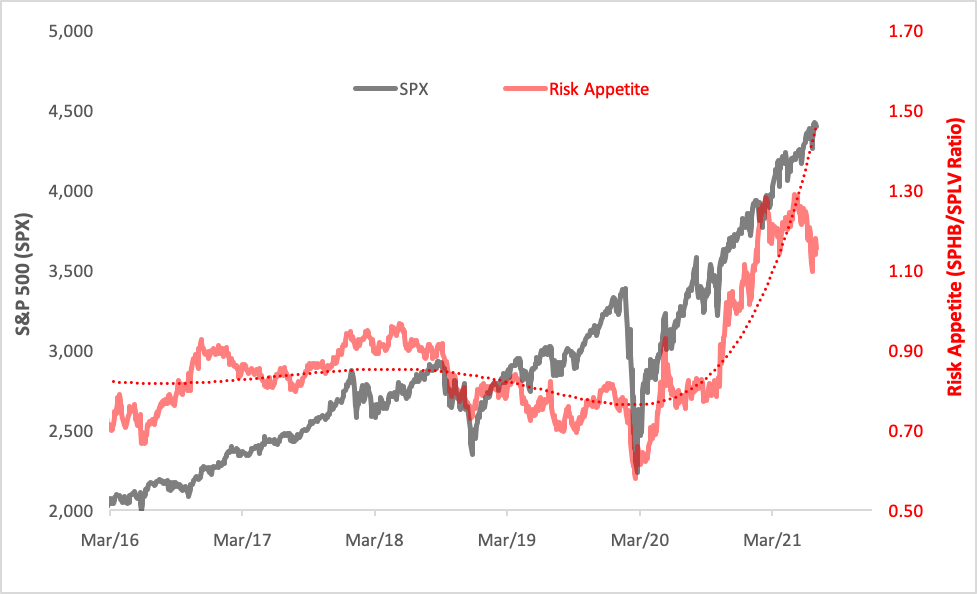
You can’t help but sense that something’s turning ‘round (or down) with respect to investors’ appetite for market risk. The chart below plots the price ratio of the two Invesco ETFs (red line) as an indicator of beta enthusiasm. You can readily see how the upward trajectory from the early-2020 crater has stalled. In fact, the ratio’s topped out and has heeled over.
Risk Appetite (SPHB/SPLV Ratio)
Are beta’s days really numbered? And, if so, what to do? Is allocating to SPLV the best way to insulate a portfolio’s domestic large-cap exposure from future volatility?
Let’s take a look at that SPLV fund. The portfolio’s index methodology is pretty simple. A hundred of the S&P 500’s least volatile stocks are pulled together and weighted in favor of the most tranquil issues. This uncomplicated scheme produced a year-to-date return of 13.50% and a 1.03% dividend yield. In contrast, the SPDR S&P 500 ETF (SPY) gained 18.15% this year against a 1.27% yield. SPLV lives up to its remit by delivering beta and volatility at a significant discount to SPY, at a cost.
Can investors do better than SPLV in the low-vol space? Well, yes, but that depends on your definition of “better.” The best performing “low-vol” ETFs may not really deliver low volatility. Often, high dividends and low volatility are conflated in investors’ minds. They shouldn’t be.
Ranked by market price appreciation, here are five of the year’s best performers among so-called “low-vol” ETFs:
- The Global X SuperDividend U.S. ETF (DIV) purports to combine a low-volatility strategy with a high-dividend-yield mandate. The operant philosophy is that consistent dividend payers present lower relative volatility. Well, maybe. DIV rose 21.75% this year with a 4.99% dividend yield, but it cranks out a 1.27 beta coefficient and an annual volatility reading near 28%.
- Up 19.77% this year, the Invesco S&P 500 High Dividend Low Volatility ETF (SPHD) whittles the S&P 500 down to 75 of its best dividend payers, then screens them for volatility, passing through 50 of the quietest stocks to the portfolio. SPHD spins off a 3.13% distribution yield with higher-than-market volatility.
- The SPDR Russell 1000 Low Volatility Focus ETF (ONEV) concentrates on more than volatility in its stock selection. ONEV pays heed to metrics of value, size and quality to sort the constituents of the Russell 1000 into a portfolio of about 400 issues. This year, the ETF has appreciated 19.49% and offers a 1.56% yield.
- Like ONEV, the SPDR MSCI USA StrategicFactors ETF (QUS) follows a multifactor strategy, taking into account quality, value and volatility to build its portfolio of 600-plus stocks. Unique among the top five ETFs, QUS earns positive alpha against SPY thanks to its below-market beta. Year to date, QUS is up 18.33%, yielding 1.44% in dividends.
- Another factor-based derivative of the Russell 1000 is the Xtrackers Russell U.S. Multifactor ETF (DEUS), which selects stocks on the basis of value, momentum, size, low volatility and quality to devise a portfolio of 800-plus issues. So far this year, DEUS has risen 16.91% while throwing off a yield of 1.20%.
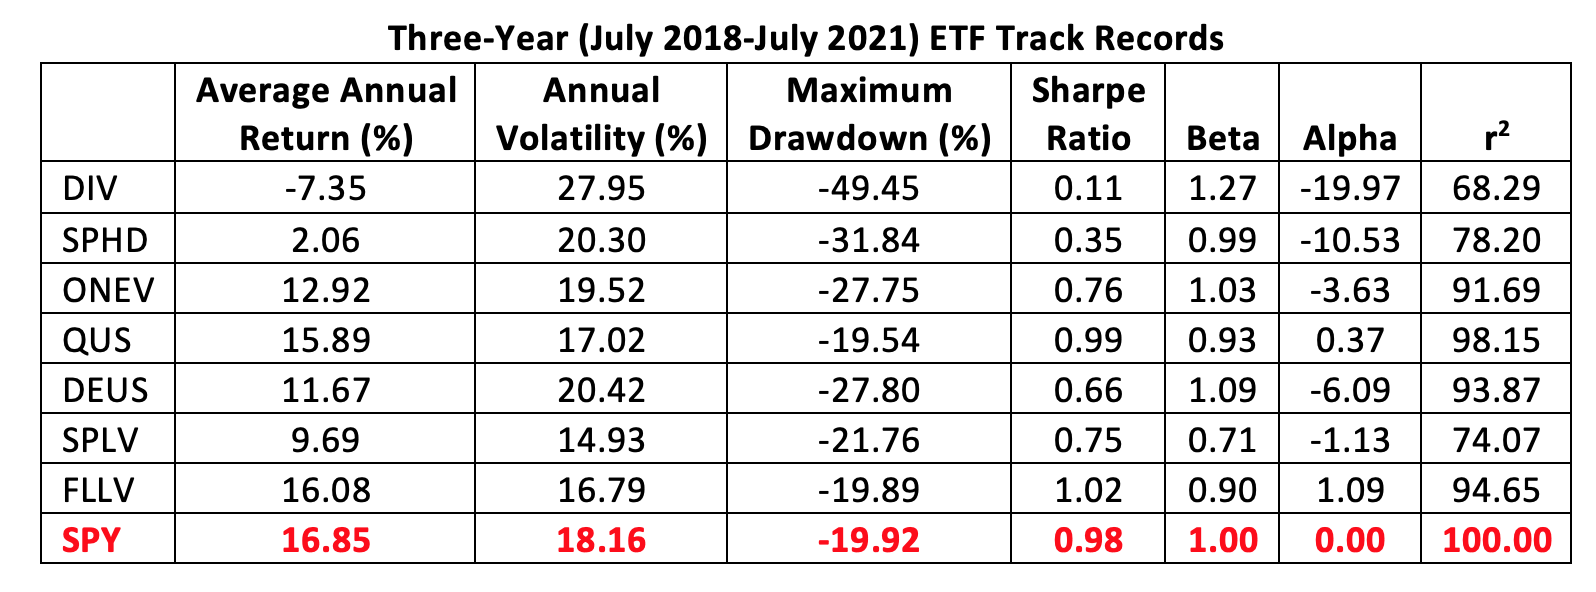
The bottom line, revealed in the table below, is that investors and advisors need to look under the hoods of ETFs lumped in the low-vol category to see if they actually tame beta over time. As we can see, it’s been hard going for most of the top five funds over the past three years. Collectively, they average a 1.06 beta coefficient.
If investors and their advisors sort the low-vol universe for standard deviation and beta rather than short-term returns, they’re likely to find better portfolio options. Take, for example, the Franklin Liberty U.S. Low Volatility ETF (FLLV), an actively managed fund that matches the sector weights of the Russell 1000. While the fund paid out 1.46% in dividends, it appreciated 14.92% this year.
More important is FLLV’s consistency. Its average annual return over the past three years is higher than our top five funds and is just barely below SPY’s. While it hews a path close to the market, its annualized volatility is lower than SPY’s, bestowing FLLV with a Sharpe ratio and an alpha coefficient both over 1.
If, and when, market volatility becomes worrisome, when last becomes first, investors and advisors may do well by looking at the bottom of our table to find a path forward.
Brad Zigler is WealthManagement's alternative investments editor. Previously, he was the head of marketing, research and education for the Pacific Exchange's (now NYSE Arca) option market and the iShares complex of exchange traded funds.


