
Say what you will about exchange-traded funds (ETFs). Love ‘em or hate ‘em, they can help you be a better investor. Why? Because they’re barometers of market sentiment. You don’t need to subscribe to expensive advisory services to get early warnings of change ahead.
Regard, for example, the relationship between the SPDR S&P 500 ETF (NYSE Arca: SPY) and the Guggenheim S&P 500 Equal Weight ETF (NYSE Arca: RSP). SPY, being capitalization weighted, tends to reflect the momentum of large-cap growth stocks. The equal weighting scheme of the RSP fund allows smaller stocks to influence the index trajectory. You might say that RSP reflects the broader market of stocks more accurately.
If you put these two ETFs into ratio (RSP divided by SPY), you can track changes in the breadth in S&P 500 price moves. When breadth expands—that is, when small stocks move in the same direction as large issues—upside moves tend be more sustainable. When breath contracts, however, the mojo for market upticks fades. The breadth ratio is an early warning of an approaching storm.
We’ve been seeing clouds forming on the market horizon since mid-February. You can see the divergence between market appreciation and breadth in the chart below. As SPY reached new highs, breadth actually shrunk. And finally, on March 1, SPY peaked to above 239. The ETF and its underlying index have been sliding ever since.

Along with the narrowing field of market leaders is a not-too-surprising diminution in correlation. The CBOE S&P 500 Implied Correlation Index (CBOE: KCL) measures the expected average correlation of S&P 500 Index components implied through option prices. KCL has fallen by 30 percent over the past year as you can see in the chart below.

What’s to be drawn from all this? Just this: We’re in an alpha hunter’s market. Through last week, excess returns were likely to be plucked from the long side. Now, the momentum is shifting in favor of the short sellers, especially among the smaller issues.
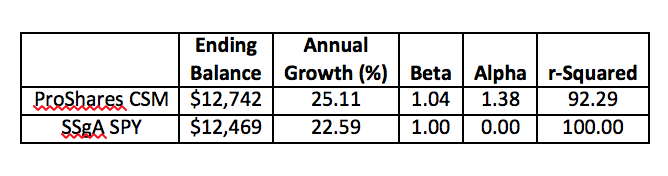
This is fertile ground for a “130/30” strategy like the ProShares LargeCap Core Plus ETF (NYSE Arca: CSM). CSM takes investors’ cash to buy a portfolio of stocks from a list of issues ranked qualitatively on their alpha potential, positive and negative. Instead of limiting its exposure to the long side, the fund sells short the stocks with the most negative expected alpha. The proceeds from the short sales are used to fund additional stock purchases. The net result? A 130 percent long exposure, together with 30 percent short exposure, yielding a portfolio with a net market exposure of 100 percent (essentially a “1.00” beta).
Over the past year, CSM has provided better-than-market performance with very market-like risk:

Brad Zigler is REP./WealthManagement's Alternative Investments Editor. Previously, he was the head of Marketing, Research and Education for the Pacific Exchange's (now NYSE Arca) option market and the iShares complex of exchange traded funds.


