
There was, back in the ’60s, a short-lived but brilliant satiric program on American TV entitled That Was the Week That Was. Oldsters like me may recall that TW3’s topical music was supplied by none other than Tom Lehrer.
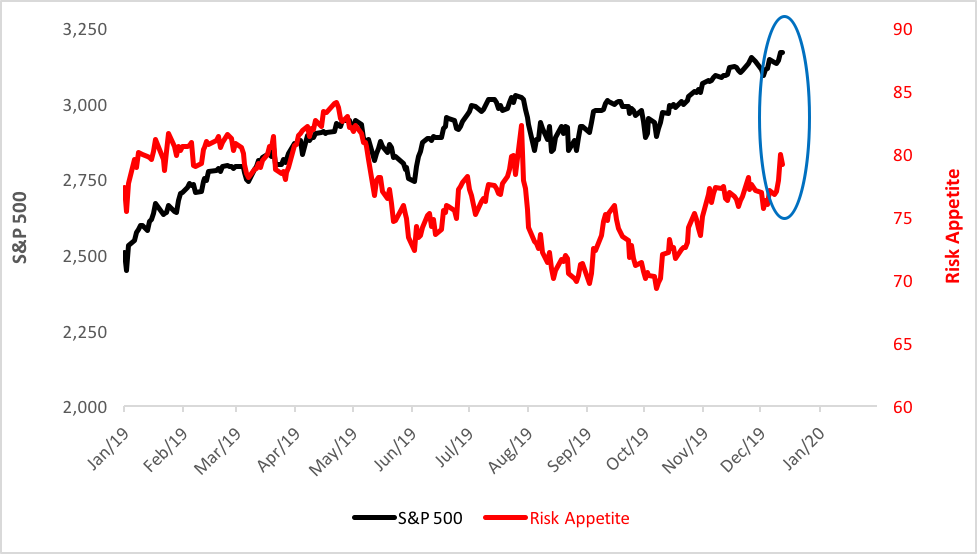
Well, last week was another week that was. Was what, you say? A week when investors flipped the risk switch on. You can see the spike in risk appetite in the graph below.
Risk Appetite Spikes
The S&P 500 reached new heights last week, propelled by pretty much every one of its business sectors. Just take a look at the weekly performance of the 11 Select Sector SPDR ETFs:
Week’s Sector ETF Performance
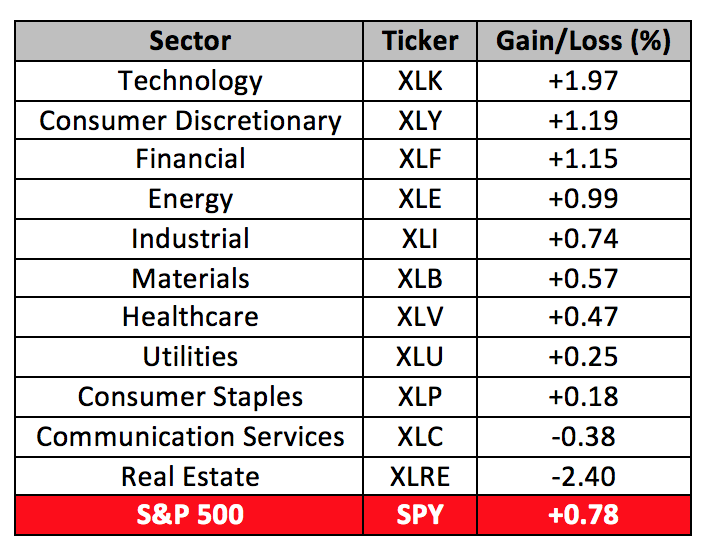
This should be very good news, no? Well, yes and no. Look at the top of the table. Tech stocks, represented by the Technology Select Sector SPDR ETF (NYSE Arca: XLK) and consumer cyclicals proxied by the Consumer Discretionary Select Sector SPDR (NYSE Arca: XLY), enjoyed market-beating gains last week. That’s not too surprising. These stocks have been on a tear for a while. And, as they’ve done well, more and more investors have piled on, making the S&P 500 top heavy.
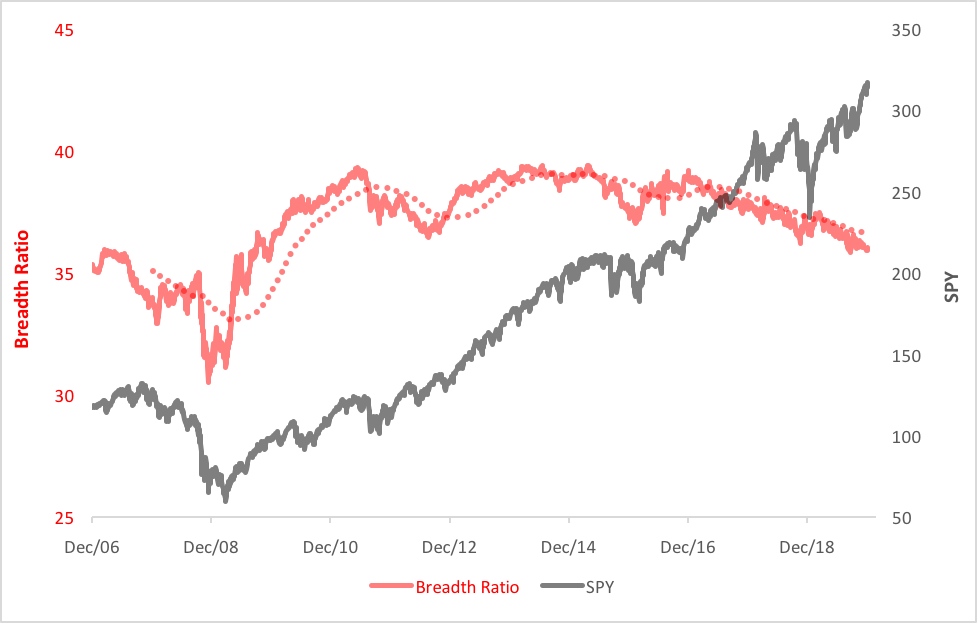
The top three stocks in the SPDR S&P 500 ETF (NYSE Arca: SPY)—accounting for more than 11% of its capitalization—are tech and cyclical issues. This concentration has been building for the past three years. You can see it reflected in the declining breadth ratio shown below. As the market’s ascended, the large-caps have only gotten larger.
Concentration Risk Builds As Market Breadth Contracts
Concentration sets up volatility, so savvy investors tend to keep an eye peeled for diversification opportunities. Last week’s numbers point to one in particular. The Financial Select Sector SPDR ETF (NYSE Arca: XLF) was the week’s third-best sector performer, just barely edged out by XLY.
For the greater part of 2019, the financial sector’s been beset by yield curve woes, but now that the curve’s steepened and earnings have improved, the segment’s outgunning the broader market. XLF, in fact, is now at a 12-year high and, over the past six months, has bested XLY’s gross return and information ratio.
Best of all, XLF doesn’t march to SPY’s drumbeat. Or, at least, XLF finds itself out of step with the broad market ETF more often than XLK and XLY are. XLF’s daily correlation coefficient over the past three years is 0.83; for XLK and XLY it’s 0.92 and 0.91, respectively. To boot, XLF’s dividend yield is substantially higher than that of XLK and XLY.
So, while it may have been a “risk on” week, that doesn’t mean investors should take on any risk.


