
You can’t say we weren’t warned of the stock market’s vulnerability before the COVID-19 outbreak. Just look what was going on with credit spreads leading up to the February break. The chart below compares the performance of the SPDR S&P 500 Trust (NYSE Arca: SPY) and the price ratio of the iShares iBoxx $ High Yield Corporate Bond ETF (NYSE Arca: HYG) over the iShares iBoxx $ Investment Grade Corporate Bond ETF (NYSE Arca: LQD). HYG is a portfolio of mostly BB- and B-rated paper, while LQD is loaded with bonds carrying A and BBB ratings.
The ratio is a simulacrum for credit spreads, reflecting the cost of money for less-than-prime borrowers.
Fluctuations in credit spreads—and, by extension, the HYG/LQD ratio—reflect shifts in the effective supply of funds.
Ordinarily, the ratio moves in sync with the equity market, so divergences are noteworthy—and, if sustained, also symptomatic. A rising ratio bespeaks tight spreads and prospects for a bullish market. Spreads widen as the ratio falls, indicating a rough patch ahead for stocks.
Recall the fall of 2018 when stocks sold off hard, bottoming just before Christmas. The HYG/LQD ratio declined as well but continued to sink further in the new year as stocks rallied to new highs.
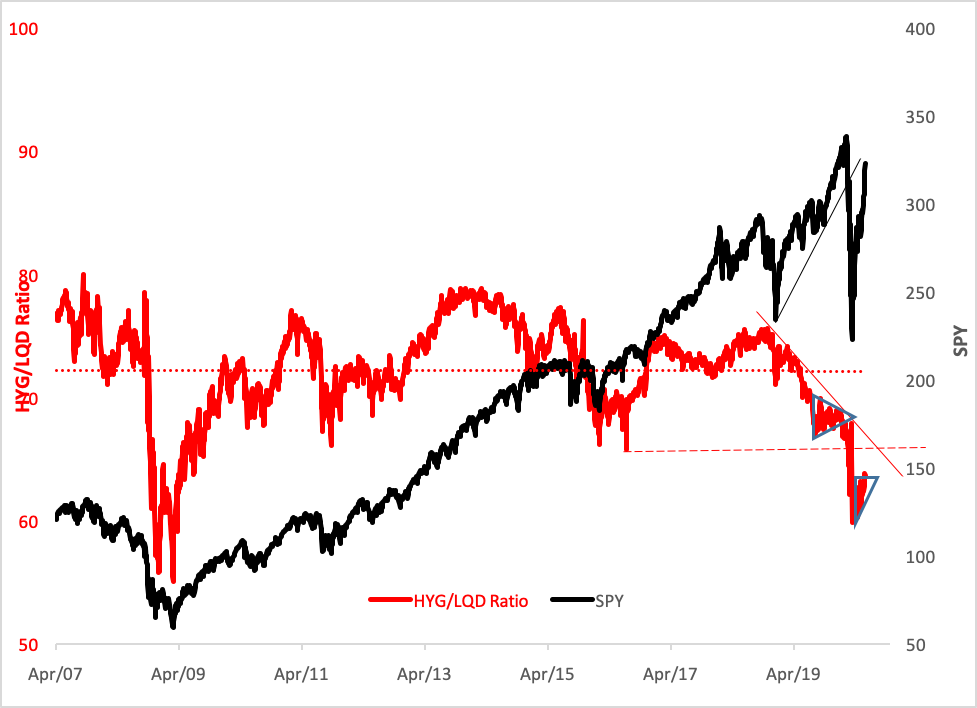
Notice how the ratio set up a wedge-shaped congestion area ahead of the February 2020 stock market break. As early as the autumn of 2019, credit spreads were flashing warning signals. Wedge patterns typically foreshadow significant, and often explosive, moves. And, indeed, what followed in 2020 was explosive: 34% of SPY’s market value was detonated.
But now SPY’s losses are being recovered as yet another congestion area—this one pointing definitively to the upside—has formed in the ratio’s trajectory. Where can the ratio—and SPY—go on a breakout?
Well, the ascending triangle pattern you see on the chart isn’t associated with the same kind of volatility that ensues from a wedge breakout. In this case, just a 4% upside from Monday’s close seems likely.
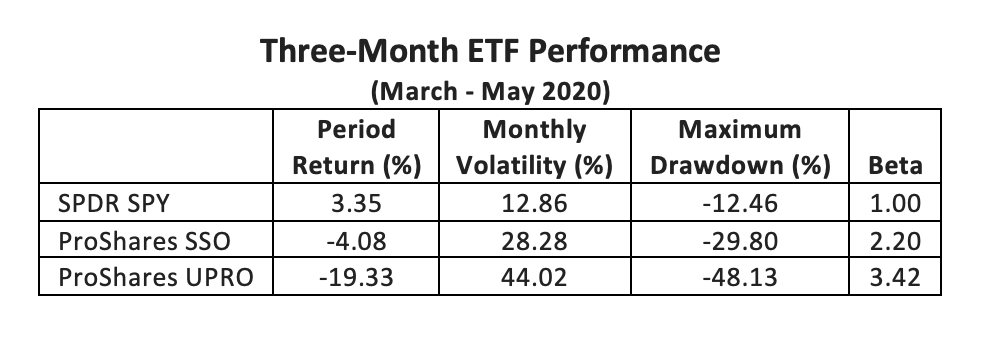
How to play this? Aggressive traders may try to ratchet up returns with levered portfolios. There’s 200% exposure to the S&P 500’s daily returns available to owners of the ProShares Ultra S&P 500 (NYSE Arca: SSO) and 300% for holders of the ProShares UltraPro S&P 500 (NYSE Arca: UPRO).
Technically, SSO’s chart points to an objective 9% higher than Monday. For UPRO, the targeted gain is 7%.
Why are the projected objectives not in the double digits? Because of the compounding of daily returns. Compare, for example, the performance of SSO to SPY’s. If SPY rises 1% on a given day, SSO should realize a 2% gain. But over time, the cumulative return realized by the two funds will likely diverge.
If SPY rises 1% for five consecutive days, its cumulative return on the sixth day would be 5.1%. SSO’s daily return would nominally be 2%, but with the compounding effect magnified by leverage, it winds up with a cumulative 10.41% return at the period’s end, more than twice the cumulative return of the unlevered SPY fund. In a continuously uptrending market, the leveraged fund will outperform its 200% multiplier.
Conversely, five continuous days of 1% declines in SPY’s value would produce a cumulative 4.9% loss, yielding a 9.61% decline in SSO’s value. That’s a more modest giveup than the 9.8% loss implied by its multiplier.
And in a volatile market? If SPY vacillates by rising 1%, then falling 1% each day over a five-day period, the fund would realize a 1.02% cumulative loss. SSO’s value would contemporaneously decline by 2.08%. Volatility, as you can see, has a more deleterious effect on a leveraged fund’s return than it does on an unlevered portfolio.
All this makes the potential return of leveraged funds more uncertain. As a real-life example, consider the ETFs’ performance over the past three months. The funds exhibited beta coefficients consistent with their daily return targets, but they produced widely disparate returns.
There’s a simpler course of action for investors. You could just bet directly on junk bonds themselves. Technically, the HYG fund is capable of another 15% upside.
But keep in mind that word capable. Capability isn’t synonymous with inevitability.
Alan Greenspan, as chairman of the Federal Reserve Board, coined the phrase “irrational exuberance” to refer to a state of undue optimism when stock prices rise without regard to flagging fundamentals or uncertainty.
After the coronavirus lockdown, one has to wonder if overconfidence is driving the market now. Certainly, FOMO (fear of missing out) is at play. With that said, we’ll be watching it closely with FC (fingers crossed).
Brad Zigler is WealthManagement's alternative investments editor. Previously, he was the head of marketing, research and education for the Pacific Exchange's (now NYSE Arca) option market and the iShares complex of exchange traded funds.


