
See the chart below? It graphs the spread between the 10-year Treasury note rate versus the S&P 500 dividend yield and the S&P 500 Index itself. You’ll note how the two metrics have moved in sync since 2014. Until this year, that is. In March, the yield spread began slumping as the blue-chip index rose to challenge its 2018 highs.
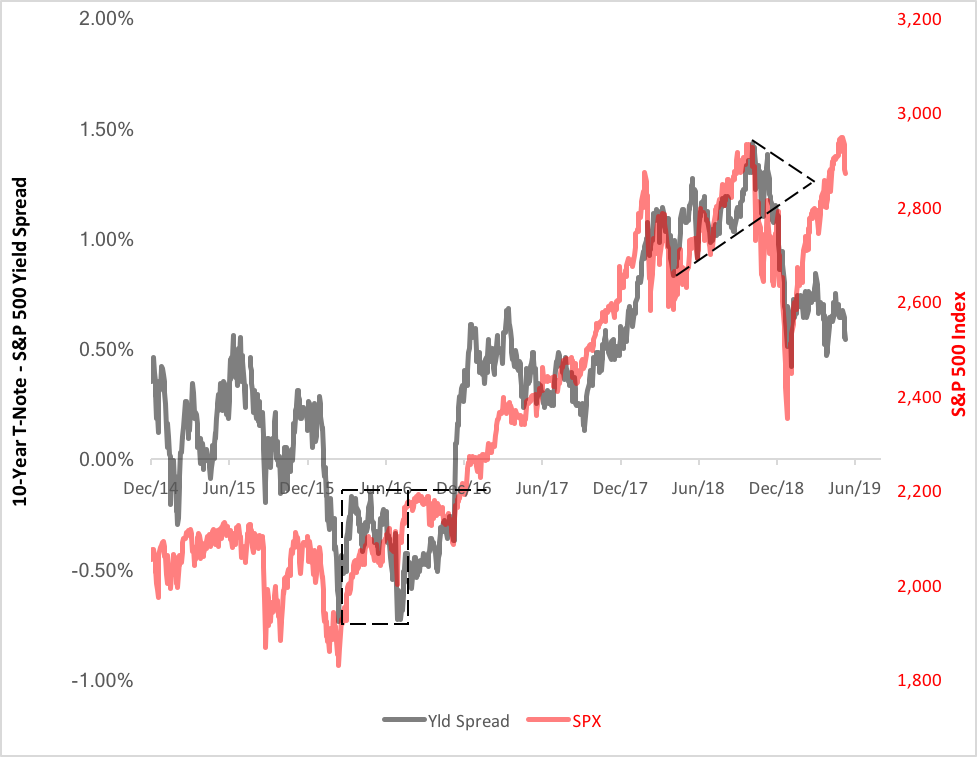
So what, you say? Well, the yield spread’s disparate trend is a manifestation of a significant market realignment.
According to research conducted by CFRA, an increasing 10-year yield premium, up to a point, correlates with decreasing S&P 500 returns a year hence. Back in 2016, when the dividend yield exceeded the Treasury rate, i.e., the yield spread was negative, a reasonable expectation for the S&P index would have been a 12-month gain of 18% or so based on five decades of historical CFRA data. As the yield spread turns positive, though, history tends to forecast ever-smaller forward stock returns. In early October 2018, the yield spread topped out at 1.43%, a level that corresponds with average forward S&P returns of just 5%.
And now, with the yield spread slumping to the 0.56% level, a 12-month stock gain around 11% seems more likely. Well, that’s good news.
But if it is, investors seem to be losing their appetite for assuming the risk to get there. The exchange traded fund market illustrates this dramatically. By comparing the price of the Invesco S&P 500 Low Volatility ETF (NYSE Arca: SPLV) against the Invesco S&P 500 High Beta ETF (NYSE Arca: SPHB), you can get a sense of investors’ enthusiasm for the S&P’s momentum stocks.
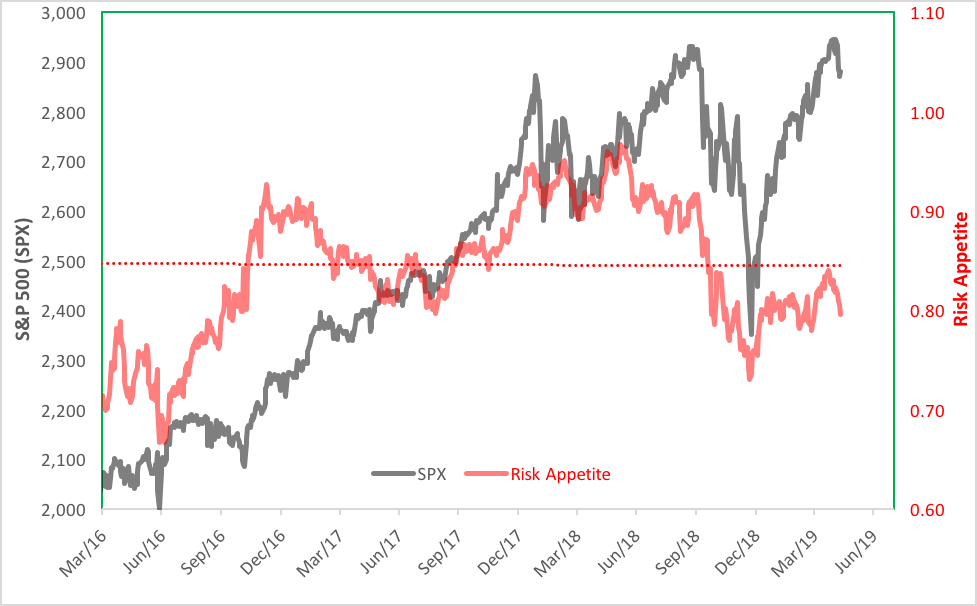
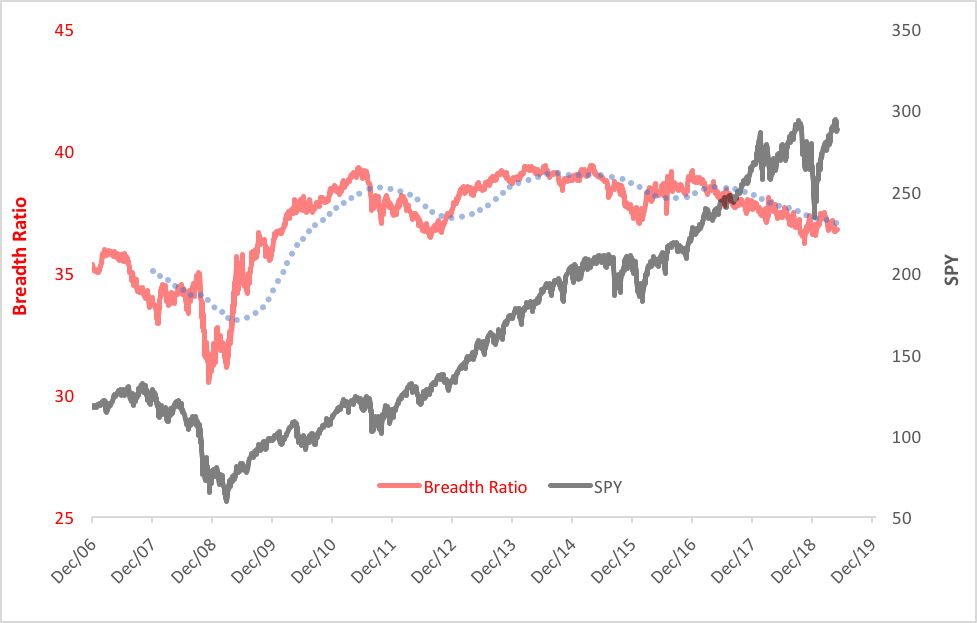
As you can see, risk appetite has been waning out of volatility fears. That’s not all. Putting another pair of ETFs side by side—the SPDR S&P 500 Trust (NYSE Arca: SPY) and the Invesco S&P 500 Equal Weight ETF (NYSE Arca: RSP)—allows you to divine the growing concentration, or lack of breadth, that’s been accompanying the S&P’s recent price surge.
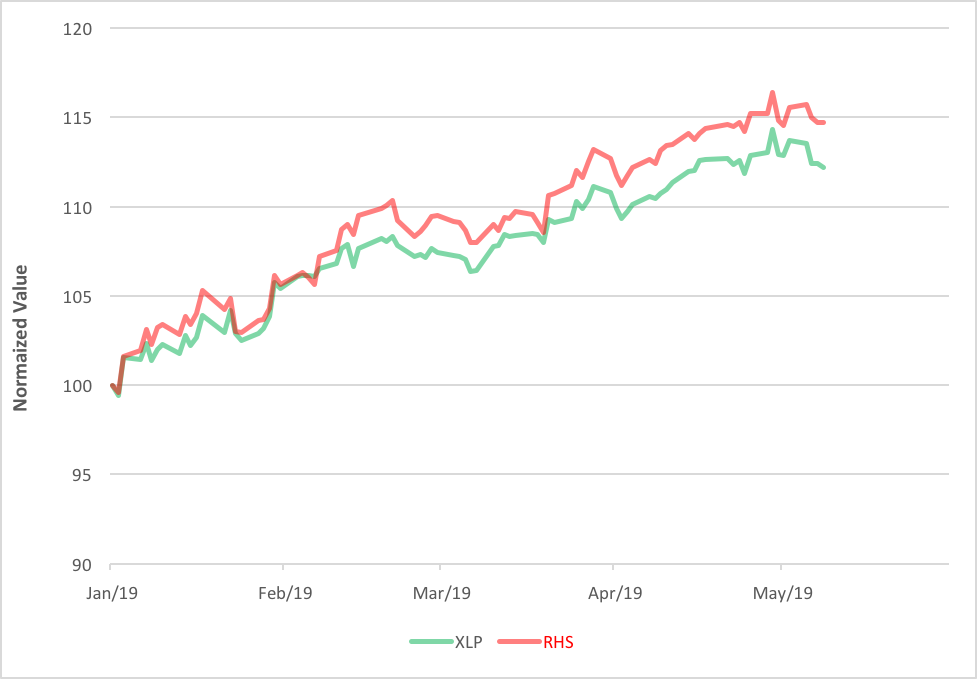
One ETF that’s benefiting from investors’ fear of volatility and concentration depredations is the Invesco S&P 500 Equal Weight Consumer Staples ETF (NYSE Arca: RHS).
Launched in late 2006, RHS is a well-seasoned and liquid ETF with a weighting scheme that mitigates the concentration found in the more well-known and cap-weighted Consumer Staples Select Sector SPDR ETF (NYSE Arca: XLP). RHS has outperformed XLP by 2% this year and now, as a result of heightened tariff fears, is also ahead of SPY, XLP’s putative parent.
There’s still room for equity gains in this late-stage bull market, but a defensive position in the consumer staples sector is certainly worth consideration. Once you get to this contemplation, you have to decide on your approach: Cap-weighted or equal-weighted? Technically, the nod goes to the equal-weighted RHS portfolio, which has the potential to gain, in the long term, about 36% from today’s level. XLY has the juice to pick up another 32%.
Budget-minded investors will undoubtedly try to balance RHS’s potential for higher forward returns against its expense. The annual price to hold RHS is 40 basis points (0.40%), while XLP costs just 13 basis points. Since the inception of the Invesco ETF, RHS has outperformed XLY by an annual average of 122 basis points.
The math seems to favor RHS.
Brad Zigler is WealthManagement's alternative investments editor. Previously, he was the head of marketing, research and education for the Pacific Exchange's (now NYSE Arca) option market and the iShares complex of exchange traded funds.


