Long before “smart beta” was a thing, some ETF providers were playing cute with stock weightings in the hope of squeezing out a little cheap alpha. Witness, for example, the Guggenheim (neé Rydex) S&P 500 Equal Weight ETF (NYSE Arca: RSP), launched in 2006. The argument for an equal-weighted benchmark was, and perhaps still is, compelling.
A capitalization-weighted index, like the original version of the S&P 500, is clearly biased toward big companies. They’re given more heft. That’s advantageous at times, but it’s a drag on performance at other points in the economic cycle. When investors are exuberant, smaller-cap issues tend to find favor; they rise at an accelerated pace. Larger, “safer” stocks are preferred when there are clouds on the financial horizon.
Assigning equal weight to all stocks in a portfolio allows greater expression of the smaller companies’ returns.
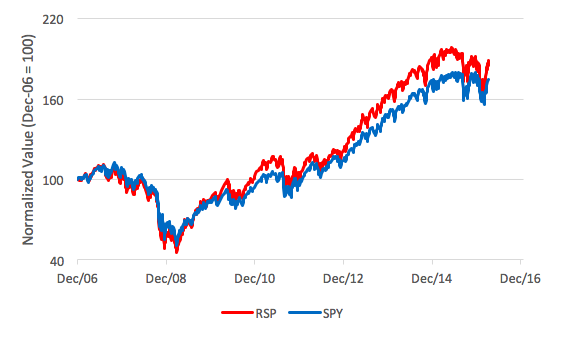
Trace the path of the RSP fund alongside that of the cap-weighted SPDR S&P 500 ETF (NYSE Arca: SPY) in the chart below and you’ll see how. In up-trending periods, RSP pulls ahead of SPY, but in downturns, SPY is more buoyant.
Chief among the contentions made against cap weighting is single-stock risk. SPY’s biggest holding, at better than 3 percent, is Apple Inc. (Nasdaq: AAPL), a weighting 15 times as large as that given to the stock in the RSP portfolio. The implication’s pretty clear. AAPL’s fortunes are going to drive SPY much more than RSP.
There’s a lesser-known risk that besets RSP, though. It’s outsized exposure to stocks with wobbly dividends.
Some stocks—those that are distressed, in particular—are small for a reason. High price and earnings volatility is often a red flag warning of dividend cuts. It’s a sort of financial cascade. Low-priced issues are more likely to be small caps. Arithmetically, falling stock prices raise dividend yields, but companies with inconsistent earnings are less likely to support their high dividend yields. Dividend cuts, in turn, repel investors, causing them to shun the stocks. Lower prices ensue.
If you peek inside the portfolios of the RSP and SPY funds, you can see how equal weighting increases concentration in dividend-threatened stocks.
Reality Shares Advisors publishes monthly dividend health ratings based on its five-tier DIVCON algorithm. Stocks assigned a “5” have the most sustainable dividends while “1”-rated issues are most likely to slash their payouts.
At last look, the weight given to the six S&P 500 Tier 1 stocks—Wynn Resorts Ltd. (Nasdaq: WYNN), EQT Corp. (NYSE: EQT), Newmont Mining Corp (NYSE: NEM), Kinder Morgan, Inc. (NYSE: KMI), Frontier Communications Corp. (Nasdaq: FTR), and Marathon Oil Corp. (NYSE: MRO)—in the RSP portfolio was two-and-a-half times that of the SPY allocation.
The bottom line? It helps to know not only what’s inside your ETF, but how much.
Note: Reality Shares recently introduced a premium Client Portfolio Scorecard service that allows investors to input portfolios of stocks and/or ETFs and receive DIVCON analyses of their holdings.
Reality Shares is offering a free year’s subscription to the first 25 WealthManagement readers who sign up at: http://www.realitysharesadvisors.com/scorecard/
Brad Zigler is REP./WealthManagement's Alternative Investments Editor. Previously, he was the head of marketing, research and education for the Pacific Exchange's (now NYSE Arca) option market and the iShares complex of exchange traded funds.


