
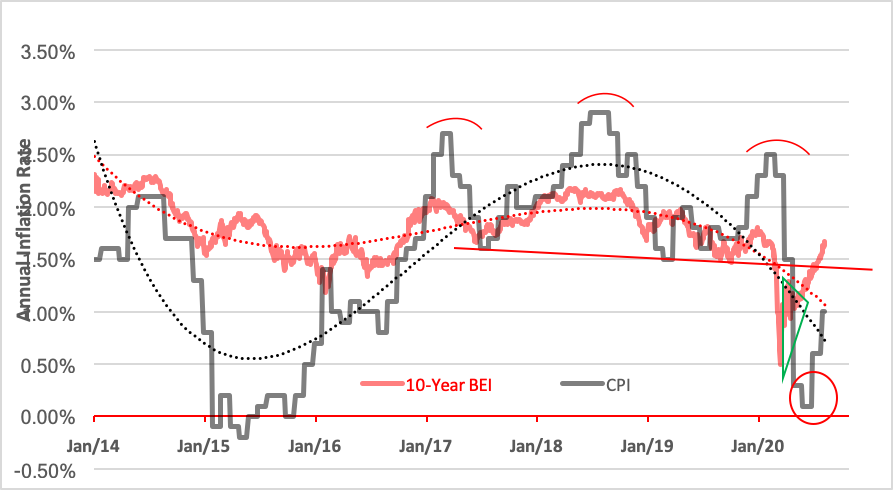
Many people are now becoming aware of inflation on a very personal level. According to the Bureau of Labor Statistics, the Consumer Price Index rose 1% year over year in July, bouncing off a base predicted by the head-and-shoulders pattern forming since March 2017.
The thing that really hits home with consumers is grocery store prices. All six major grocery store food indexes rose over the past year—led by a 14.2% hike in beef prices that, in turn, contributes to an 8.4% increase in the index for meats, poultry, fish and eggs. Other prices have risen more modestly, ranging from a 2.3% hike in fruits and vegetables to a 5% increase in the cost of nonalcoholic beverages.
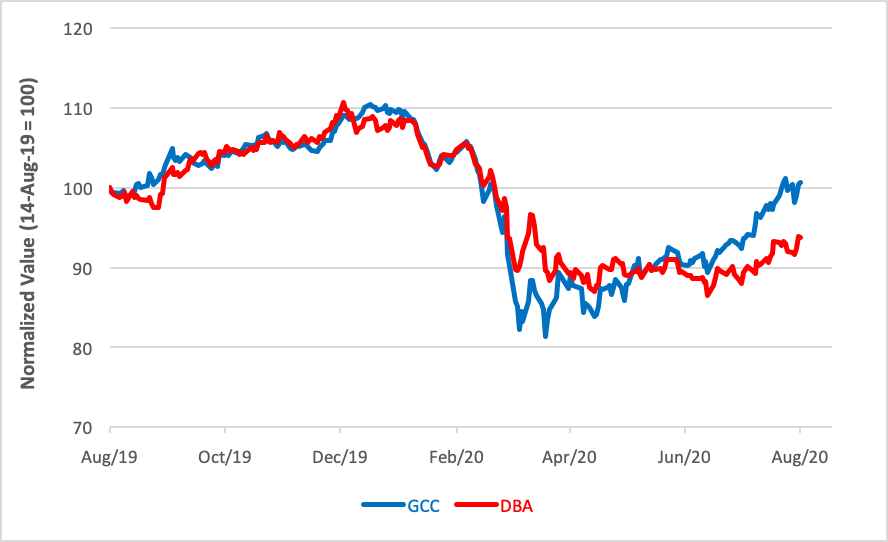
You can see how inflation has been creeping back into raw commodity prices after a precipitous drop at the top of the year. The equal-weighted Wisdom Tree Continuous Commodity Index ETF (NYSE Arca: GCC) has climbed back to breakeven after being underwater since March. Subsumed within GCC’s underlying index are the agricultural commodities that figured into the CPI rebound, most particularly livestock.
Even more finely attuned to consumers’ demand for foodstuffs is the Invesco DB Agriculture Fund (NYSE Arca: DBA), which tracks an index of 10 agricultural commodity futures contracts. DBA gives over 17% of its portfolio weight to livestock.
So, is inflation a thing? Well, the expectation of inflation certainly is. The bounce in the Consumer Price Index was presaged by a near-vertical upswing in inflation expectations proxied by the 10-year breakeven inflation (BEI) rate. In fact, a so-called “golden cross” appeared in the BEI chart last week when the indicator’s 50-day moving average crossed above its 200-day mean. Such crossovers are fairly reliable harbingers of continuing upward pressure.
The power of this signal was well demonstrated during the Great Recession. A bullish BEI crossover occurred in May 2009 when the Consumer Price Index trend dawdled in negative territory. By the time the BEI’s trend indicator turned down—that is, when the 50-day average crossed below the 200-day—in June 2010, the price index’s annual inflation rate had risen 270 basis points (2.7%).
Could we see a repetition of this phenomenon in the wake of the COVID-19 pandemic downturn? Who am I to say no? It’s enough, at least, to make a cautious advisor start looking for inflation hedges that can be effectively layered into investor portfolios. Of the several exchange traded funds that tout their ability to beat inflation, the standout is the one that uses the best-known inflation indicator, the CPI, as its ticker symbol.
The IQ Real Return ETF (NYSE Arca: CPI) is a fund of funds with nearly 90% of its holdings invested in fixed income portfolios. Of these, the overwhelming majority hold Treasury securities.
The fund’s self-avowed objective is to beat inflation, i.e. provide a “real return.” With nearly all of CPI’s bond allocations concentrated in the short end of the yield curve, however, the fund’s falling short of its goal.
Short-term bonds typically exhibit the greatest yield volatility. While yields have been ratcheted down in the past year, that hasn’t resulted in much, if any, appreciation in the CPI’s short-term bond ETFs. In fact, two of CPI’s three top holdings—accounting for three-quarters of the fund’s capitalization—have actually lost ground in the past 12 months.
There isn’t much offset in the CPI portfolio, either. The fund’s components are selected by means of a proprietary methodology and presently include, in only small measure, S&P 500 and real estate exposures. Those small equity allocations haven’t gotten CPI much closer to its objective. Over the past 12 months, CPI’s share price has slid underwater. Counting dividends, the fund’s total return is less than a half-percent, well short of the year-over-year appreciation of the Consumer Price Index.
Looking at its 13-fund portfolio, CPI doesn’t seem to be built for success. There’s a lot of duplication, for one thing. Inexplicable duplication. What’s the advantage gained by owning shares of both the SPDR S&P 500 Trust (NYSE Arca: SPY) and the iShares Core S&P 500 (NYSE Arca: IVV)? Or three virtually indistinguishable real estate ETFs? And then there’s the overlap in the fixed income holdings.
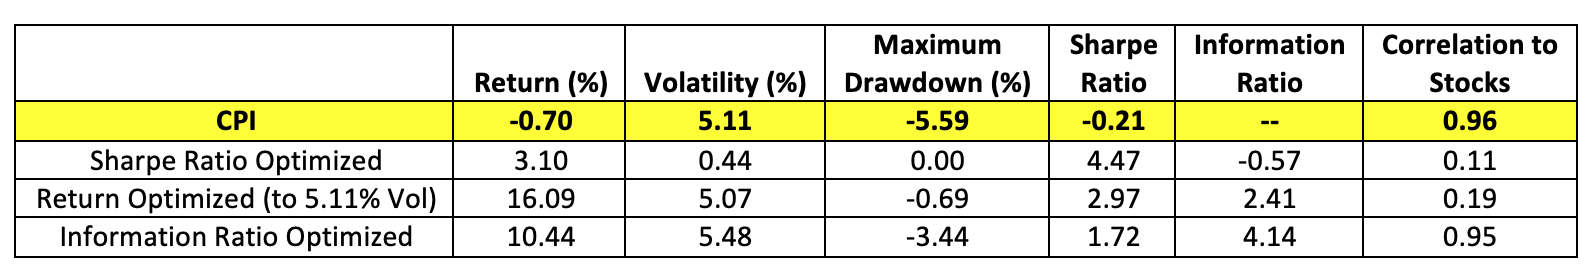
Clearly, CPI is not optimized for high returns. Neither is it geared to maximize its Sharpe ratio. Or to provide much diversification away from the equity market for that matter. The table below shows how the present CPI portfolio fared over the past year compared with three versions rationalized to better express key factors most often at the heart of an overall investment strategy.
Each optimization, it should be said, is unconstrained—meaning there are no limits imposed on the size of the individual components. Think of these as idealized portfolios. Your mileage may vary.
In the portfolio optimized for the highest obtainable Sharpe ratio, only four components of CPI’s baker’s dozen pass through:
- iShares Short Treasury Bond (NYSE Arca: SHV)—This market-weighted portfolio of ultra-short government paper (maturities of 12 months or less) earns a 52% allocation;
- Invesco Treasury Collateral ETF (NYSE Arca: CLTL)—Another take on ultra-short debt securities, CLTL exhibits more volatility and a lower Sharpe ratio than SHV but at a higher return. Accordingly, it’s afforded 31% of the optimized portfolio;
- iShares 3-7 Treasury Bond (Nasdaq: IEI)—Exposure to intermediate-term Treasurys is throttled to 14%;
- SPDR S&P 500 Trust (NYSE Arca: SPY)—Just 4% of the optimized mix is given over to large-cap stocks, though this exposure is quadruple the S&P 500’s weight in the CPI portfolio.
Rationalizing for the other factors further reduces the number of CPI components: three for the information ratio-optimized portfolio and just two for the mix designed to maximize return.
Naturally, an individual investor’s unique circumstance may impose necessary constraints on an optimized portfolio. Suffice it to say that the synthesis that aims to boost the Sharpe ratio needs the least attenuation. It’s cheaper to hold as well. Rationalizing costs only 13 bp versus the 44 bp annual expense for CPI.
Something to consider if inflation continues its upward trajectory.


