
Record 2020 ETFs inflows was driven by all major asset categories. Investors added $504 billion of new money to U.S. listed ETFs last year according to CFRA’s First Bridge ETF database, the highest cash haul in history, pushing the assets under management past $5 trillion and nearly halfway to the next trillion level. While 77% of the $5.48 trillion of ETF assets is in equity products, the asset category gathered just 49% of overall net inflows. Fixed income ETFs were the story of the year, in our opinion, with a record $206 billion equaling 41% of the industry’s asset gathering, more than double the fixed income category’s 19% share of the asset base. In addition, commodity ETFs, pulled in 8.2% share of the new money last year, triple the category’s 2.7% share.
Chart 1: Market Share of ETF Assets and Net Inflows
CFRA’s First Bridge ETF Database. As of December 31, 2020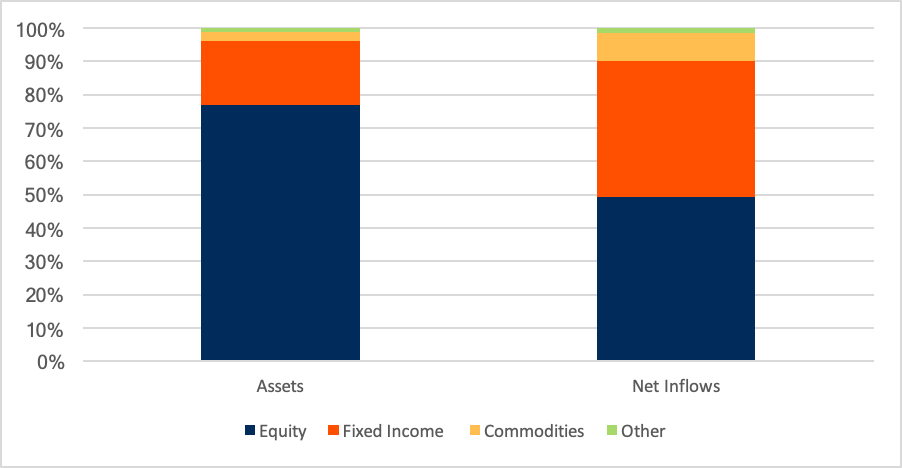
Five of the ETFs with the highest net inflows in 2020 were fixed income products, with Vanguard Total Bond Market ETF (BND) and iShares iBoxx $ Investment Grade Corporate Bond (LQD) leading the way with $17 billion and $15 billion of net inflows, respectively. With $32 billion, Vanguard Total Stock Market (VTI) gathered the most money in 2020 across the industry.
While broad market exposure ETFs were popular, investors added to targeted funds as well. The five most popular ETFs in 2020 are classified by CFRA in a Broad Market equity or fixed income sub-category as investors further embraced ETFs strategically to support efforts to build asset allocation based strategies. While we expect this trend to persist in 2021, investors also gained comfort in using ETFs for more tactical purposes. Fixed income ETFs providing exposure to only corporate bonds, such as LQD and Vanguard Intermediate-Term Corporate Bond ETF (VCIT) pulled in $83 billion of new money in 2020, more than the $75 billion and $73 billion for Fixed income – Broad Market and U.S. Equities – Broad Market & Size sub-categories.
Chart 2: Sub-Category ETF Demand in 2020
CFRA’s First Bridge ETF Database. As of December 31, 2020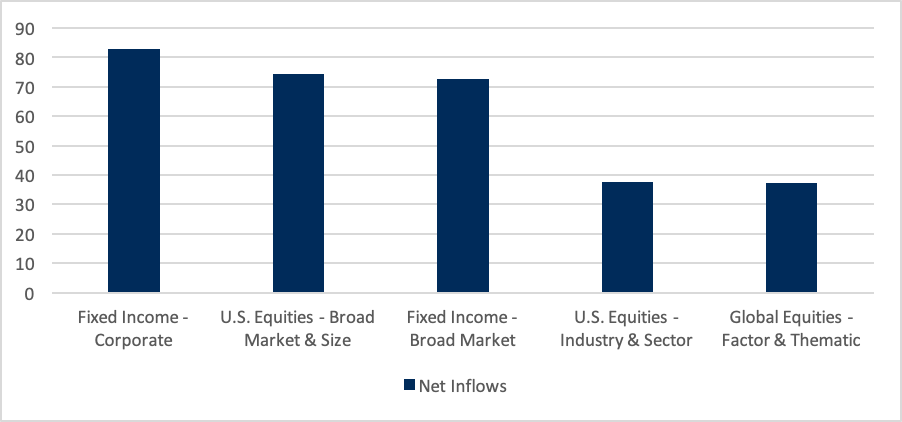
Meanwhile, U.S. Equities – Industry & Sector ETFs gathered $38 billion of new money last year led by $6.3 billion into Energy Select Sector SPDR ETF (XLE), which fell 33% in value. Industrials Select Sector SPDR ETF (XLI) and Vanguard Information Technology ETF (VGT), both of which CFRA believes is likely to outperform in 2021, were other popular funds in the sub-category.
Rounding out the top five sub-categories based on net inflows, were factor and thematic ETFs that invest in global equities. ARK Innovation ETF (ARKK) and ARK Genomic Revolution Multi-Sector ETF (ARKG), which each more than doubled in value in 2020, gathered $9.6 billion and $5.3 billion, respectively. While ARKG is focused on next generation health care companies, ARKK has high exposure to communications services, consumer discretionary, information technology as well as health care holdings.
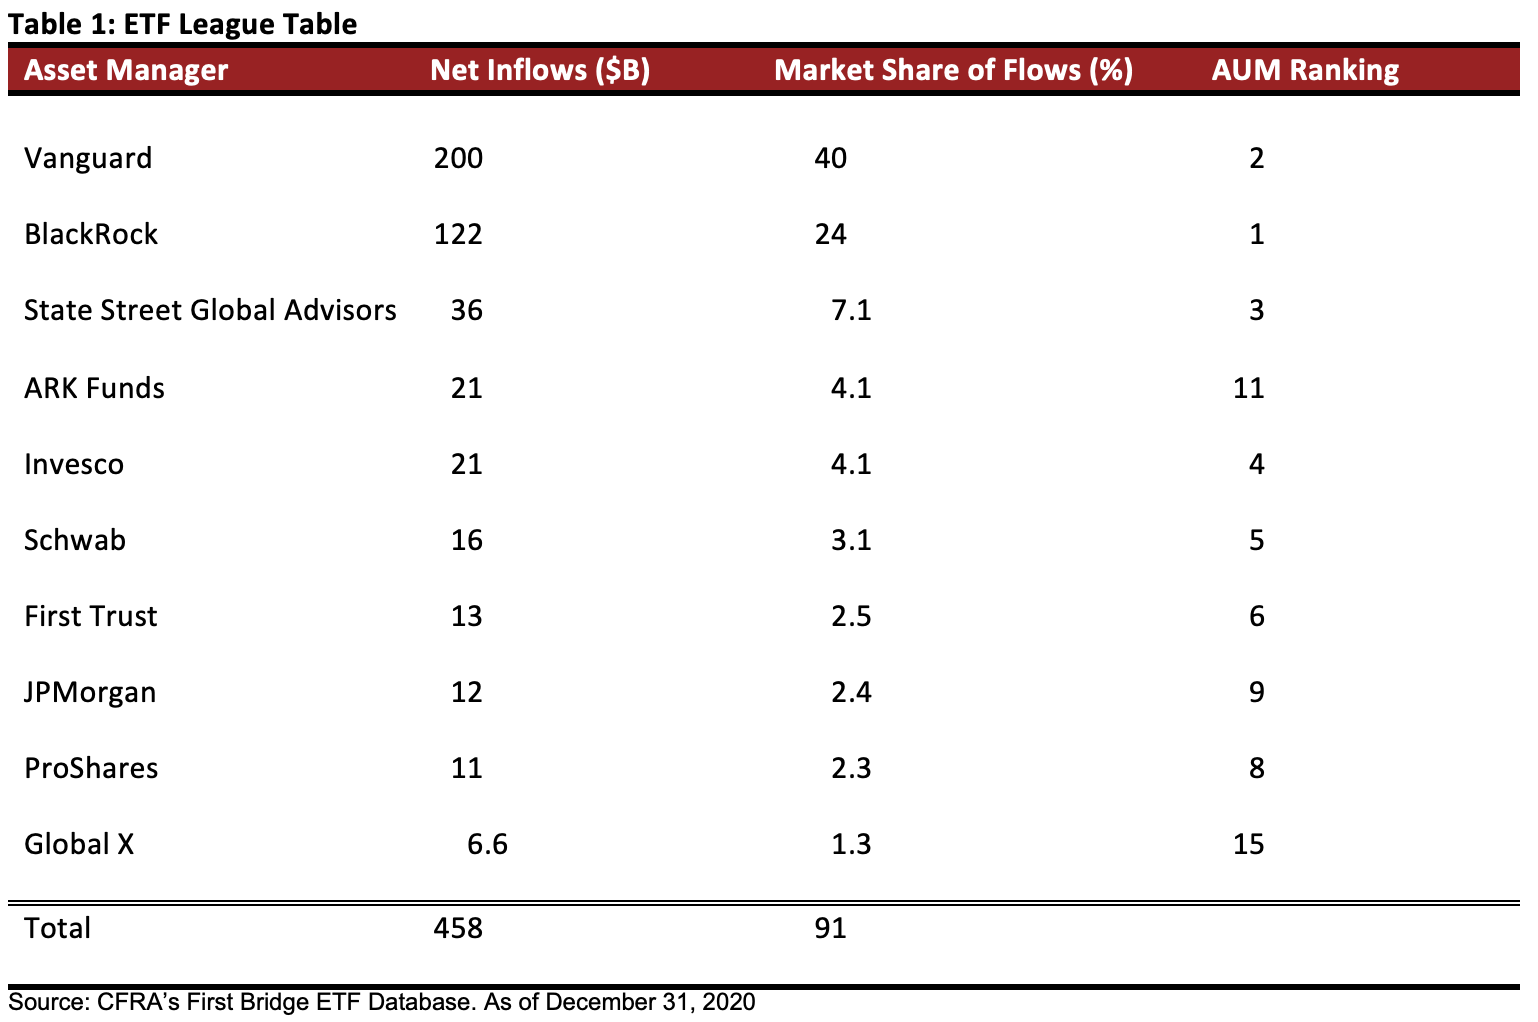
ARK actively crashed the ETF league in 2020. The top-three ETF providers—BlackRock, Vanguard and State Street Global Advisors—pulled in 71% share of the new money in 2020. Vanguard alone pulled in $200 billion, which was more than the $121 billion for its larger peer BlackRock as Vanguard had far fewer ETFs on the top-outflows list. In addition, Vanguard further distanced itself from the third largest provider State Street Global Advisors as its $1.5 trillion was nearly double State Street’s $845 billion.
However, ARK’s $21 billion cash haul was the fourth highest among ETF asset managers, equal to more than 4% of the industry’s net inflows. The firm closed the year as the 11th largest provider with $35 billion in assets, serving as a reminder than there’s interest in active not just index-based ETFs.
Other firms that punched above their weight in 2020 were Global X and JPMorgan. Global X gathered $6.6 billion, the 10th highest, despite being just the 15th biggest provider. The firm’s thematic ETFs, such as Global X Cloud Computing ETF (CLOU), gained in popularity throughout the year. Meanwhile, JPMorgan pulled in $12 billion, equal to 2.4% share of the net inflows, triple its 0.8% share of the assets. The firm’s low cost asset allocation based products, including JPMorgan BetaBuilders International Equity ETF (BBIN), as well as active fixed income ETFs, such as JPMorgan Ultra-Short Income ETF (JPST) were in demand.
A combined 91% of the $504 billion of net inflows gathered in 2020 was concentrated in just 10 ETF providers, including Invesco, ProShares and Schwab.
Table 1: ETF League Table
Conclusion
Despite a record breaking year for the ETF industry, CFRA thinks there is significantly more room for growth. Investors that saw the liquidity, tax efficiency and diversification benefits ETFs provider are likely to further embrace the products. Meanwhile, asset managers will see the opportunity to offer active and/or thematic ETFs bringing a fresh supply of products to market. CFRA stands ready to provide insights into these ETFs as we provide a star rating on more than 1,850 of these funds from a risk, reward, and cost perspective.
Todd Rosenbluth is the director of ETF and mutual fund research at CFRA. Learn more about CFRA's ETF research here.


