
A twice-yearly pall has settled over mutual fund managers in the wake of the latest SPIVA Scorecard’s release. For the past 14 years, the S&P Indices Versus Active Funds Scorecard, now published by S&P Dow Jones Indices, has measured the performance of actively managed equity and fixed income portfolios against their respective benchmarks.
The Scorecard, according to its sponsor, is the “de facto scorekeeper of the active-versus-passive debate.”
And, as is usually the case, the latest edition shows that, in the aggregate, active management tends to underperform passive management, net of fees. For the one-year period ending June 30, 2016, only 9.8 percent of 2,600+ domestic equity funds beat the performance of the S&P Composite 1500 Index.
On the fixed income side, the one-year results were sunnier for active managers in medium-term investment-grade paper, leveraged loans and municipal debt. Sixty percent of managers benchmarked against the Barclays Intermediate Government/Credit Index outperformed the yardstick. About the same percentage of senior loan funds beat the S&P/LSTA U.S. Leveraged Loan 100 Index. And, on average, about 72 percent of California and New York municipal debt funds outperformed their respective S&P benchmarks.
Unfortunately, the SPIVA Scorecard covers mutual funds only. If you want to know how exchange traded funds (ETFs) are faring, you’re pretty much on your own. Luckily, you don’t have to pore over thousands of portfolios. According to the Morningstar database, there are only 158 actively managed ETFs extant.
If you sort the database for positive alpha—the classic footprint left by successful active managers—you end up with just 19 funds. That’s just 12 percent across all categories, equities and fixed income alike. Only six of these alpha-positive portfolios are on the equity side. Can active management be that difficult for ETF managers?
Yes and no. One thing we know from our previous examination of active ETFs: If you search Morningstar data for ETFs with high alpha, your results will likely be based on a “standard index” and may be radically different than the output you’d get if you culled the field using the “best-fit” index. Our exemplar then and now is the chart-topping PowerShares Active U.S. Real Estate ETF (NYSE Arca: PSR).
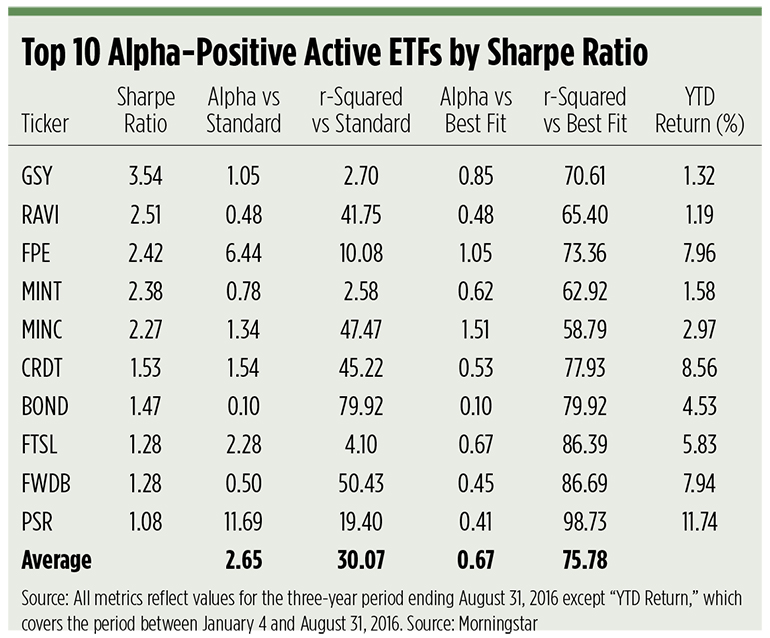
PSR earned an astounding 11.69 alpha against Morningstar’s standard index over the last three years. But dig down a little and you’ll find the default benchmark is, for some reason, the MSCI All Country World Index. PSR’s r2 (r-squared) correlation against the index is only 19.40, even though Morningstar declares the “best fit”—at an r2 of 98.73—to be the Morningstar U.S. Real Estate Index. Against the best-fit index, PSR earns a 0.41 alpha.
Now, you have to ask yourself why you’re looking at alpha in the first place. Do you want to find out how good a manager is at “beating the market”? If so, shouldn’t the “market” in PSR’s case be U.S. real estate instead of world equities? I mean, if you’re looking to fill a real estate allocation in your portfolio, you’re not going to consider international stock funds, are you?
Then ask yourself if you’re most interested in finding the alpha-producing fund with the best risk-adjusted returns. If so, you may want to screen for the Sharpe ratio. The Sharpe ratio takes the measure of a fund’s volatility against its return. Essentially, it tells how many units of return are earned per unit of risk. Commonly, a ratio of 1.00 is considered “good,” a ratio of 2.00 is thought of as “very good” and a ratio of 3.00 or better is acknowledged as “exceptional.”
If you screen your alpha-positive active ETFs for Sharpe ratios now, you’ll end up with a top 10 list that’s almost universally populated by bond funds. Nine of the funds are benchmarked by Morningstar to the Barclays U.S. Aggregate Bond Index (BAGG).
Positive Sharpe, Positive Alpha
According to its sponsor, the Guggenheim Enhanced Short Duration ETF (NYSE Arca: GSY) aims to outperform the Barclays 1-3 Month U.S. Treasury Bill Index, but Morningstar assigns BAGG as its yardstick for alpha measurement. Perhaps that’s because GSY’s portfolio, incorporating bank loans, commercial paper and repurchase agreements, is so eclectic. The aggregate bond benchmark, however, explains virtually nothing about GSY. Morningstar’s determined the S&P/LSTA Leveraged Loan 100 Index to be GSY’s best fit.
The BAGG index—at an r2 of 41.75—does a better job elucidating the trajectory of the FlexShares Ready Access Variable Income ETF (NYSE Arca: RAVI), but Morningstar believes its Conservative Target Risk Index, partly made up of equities, is a better fit. RAVI, like GSY, is an ultrashort bond portfolio that invests in public and private debt both here and abroad.
While the First Trust Preferred Securities and Income Fund (NYSE Arca: FPE) portfolio contains preferred shares in addition to debt securities, it’s benchmarked to the BAGG index by Morningstar. That’s odd because FPE goes offshore for nearly 40 percent of its exposure. That may well explain the lowly 10.08 r2 coefficient. Against the best-fit BofA Merrill Lynch Core Fixed Rate Preferred Securities Index, though, the fund earns an impressive 1.05 alpha.
Another fund benchmarked to BAGG, the PIMCO Enhanced Short Maturity Active ETF (NYSE Arca: MINT), invests in investment-grade corporate debt, asset-backed securities and money market instruments. MINT earns distinction by having the lowest correlation to BAGG. Its r2 coefficient against the BofA Merrill Lynch U.S. High Yield Master II Index, its best-fit benchmark, is much higher.
The AdvisorShares Newfleet Multi-Sector Income ETF (NYSE Arca: MINC) is a diverse short-term bond portfolio made up of corporate, municipal and mortgage-backed paper. The fund earns a better alpha coefficient against its best-fit index, the Morningstar Conservative Target Risk Index, than its standard BAGG yardstick.
A world bond fund, the WisdomTree Strategic Corporate Bond ETF (Nasdaq: CRDT), is, oddly enough, twice benchmarked against domestic stock indices. Its standard index is, again, BAGG. Its best fit, according to Morningstar, is found against the Barclays U.S. Credit Index—essentially BAGG less government and agency issues.
The PIMCO Total Return Active ETF (NYSE Arca: BOND) makes things easy. Its standard and best-fit indices are one and the same. And no wonder. The fund’s investment objective is to keep its duration close to that of the Barclays U.S. Aggregate Bond Index, which is currently about five years.
Not surprisingly, the best fit for the First Trust Senior Loan ETF (Nasdaq: FTSL) is the S&P/LSTA Leveraged Loan 100 Index. It’s no surprise, either, that the fund’s r2 coefficient against its standard index, BAGG, is dismally low. FTSL gooses up its yields with a smattering of high-yield paper.
Morningstar sets BAGG as the standard index for yet another world bond fund, the AdvisorShares Madrona Global Bond ETF (NYSE Arca: FWDB) to middling results. A much higher correlation is obtained against the best-fit index, the Morningstar Conservative Target Risk Index.
The Bottom Line
The takeaway for all this? It’s summed up in the averages. The advertised alpha—that earned against standard indices—is four times higher than the coefficient secured from the best-fit benchmarks. The differential in r2 correlations is less dramatic but just as significant. The best-fit indices were two and a half times better as explainers of the ETFs’ price action. Knowing this, you should dig into your metrics a little when you’re screening funds to see if they make sense. You may be getting a lot less alpha than you think.
Still, there’s an upside to all those low r2 coefficients versus the Barclays U.S. Aggregate Bond Index. If you already have exposure to BAGG, the funds with low correlations could provide some risk diversification. In that regard, GSY, MINT and FTSL may be particularly useful as components on the bond side of your portfolio.
Brad Zigler is WealthManagement.com's Alternative Investments Editor. Previously, he was the head of Marketing, Research and Education for the Pacific Exchange's (now NYSE Arca) option market and the iShares complex of exchange traded funds.


