
Should auld acquaintance be forgot? Certainly not for ETFs. After all, some are on a roll. Namely, domestic large-cap blend ETFs. Last year was a good one for most of the 160 portfolios in this category.
The category’s best performer seems to be the VanEck Vectors Morningstar Wide Moat ETF (Cboe BZX: MOAT), a fund that’s cranked out a gain of better than 33 percent on the year, bettering the return of the iShares Core S&P 500 ETF (NYSE Arca: IVV) by more than five percentage points.
MOAT’s $3.3 billion portfolio is populated by stocks of companies with significant competitive advantages, e.g., low structural costs, high barriers to entry, patents, etc., that protect their market shares.
Nominally, the MOAT portfolio holds 40 names. Why nominally? Because of the portfolio’s rebalancing methodology. Half of the portfolio is reconstituted with equal weights at six month-intervals. The remaining half is rebalanced three months later. Constraints on turnover and sector exposure then kick in which can cause the ETF to hold more than 40 stocks at any given time. Presently, for example, the MOAT portfolio owns 48 issues ranging from Biogen Inc. (Nasdaq: BIIB) to McDonald’s Corp. (NYSE: MCD).
MOAT’s given its investors market-beating returns in 2019 at the cost of volatility. MOAT’s standard deviation is a fifth higher than IVV’s. That does no favors for MOAT’s alpha coefficient. With a beta of 1.18, the VanEck portfolio chalks up a -0.60 alpha reading for the year.
Look beyond alpha to the information ratio, though, and you can see that MOAT’s bets have paid off rather handsomely. The information ratio is found by dividing a portfolio’s excess return—versus the IVV benchmark—by its tracking error. Simply put, the information ratio informs (get it?) an investor of the consistency of the payback for the fund’s active bets. In 2019, MOAT earns an information ratio of 1.11.
Okay, you say, is that ratio exceptional? In a word, yes. A ratio between 0.4 and 0.6 typifies a good investment. Any value above 0.61 is considered a great investment.
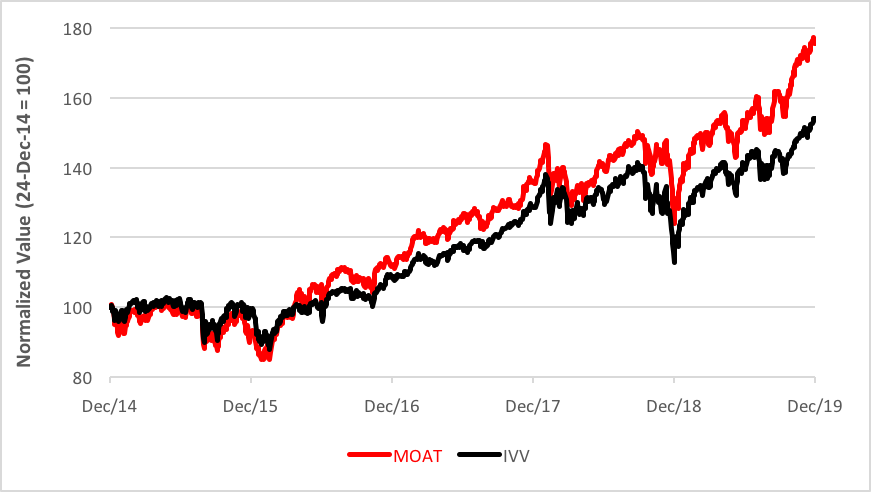
Fine, but is 2019 a fluke? Is there constancy to MOAT’s outperformance? Turns out, there is. Just take a gander at the five-year chart below. On a cumulative return basis, MOAT caught up with and surpassed IVV in 2016 and hasn’t looked back since.
Daily Performance
(December 2014 through December 2019)

Judging the numbers above, things seem to have just gotten better for MOAT as time passed. But what of the future? Well, technically, there still seems to be room on the upside for the VanEck fund. A near-term target 7% above today’s price looms. At that point, it will be time to reassess the risk of holding MOAT as a core position.
Brad Zigler is WealthManagement's Alternative Investments Editor. Previously, he was the head of Marketing, Research and Education for the Pacific Exchange's (now NYSE Arca) option market and the iShares complex of exchange traded funds.


