


Investors hoping their alternative investments would offer hedge protection from September’s market volatility were left to wonder if their glasses were half-full or half-empty. Only one of our benchmark ETFs cranked out a gain last month and that outlier was the ProShares Short S&P 500 ETF (SH) a straight-out image miroir of the S&P 500. On average, our alt ETFs gave up 3.9% of their value in September. While that was a significantly lighter loss than the 9.2% hit suffered by the SSgA SPDR S&P 500 ETF (SPY), it was still a debit.
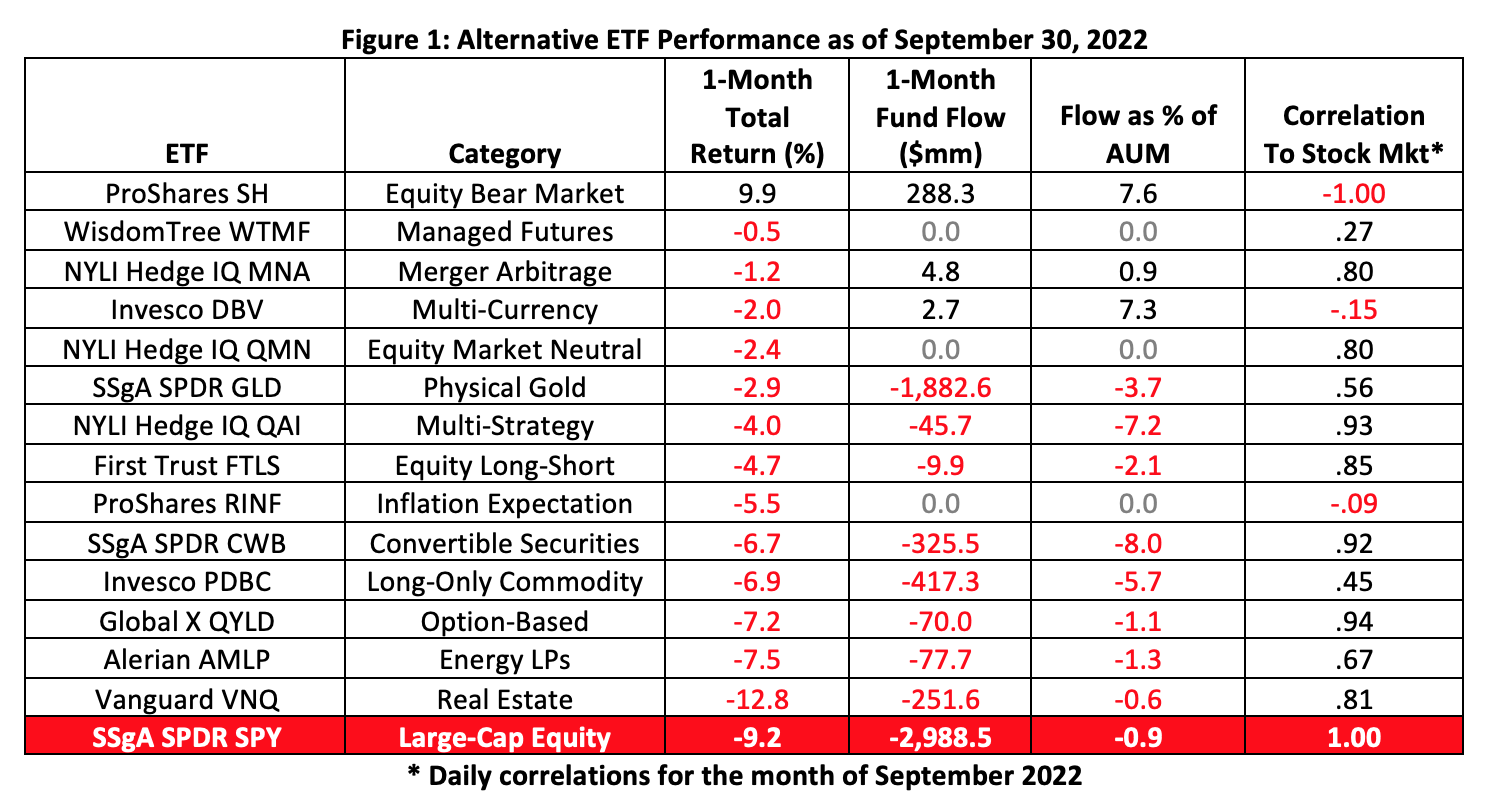
As seasoned portfolio builders know, hedge protection arises through some combination of leverage, correlation and volatility. There’s no leverage in our roster of alt ETFs (see Figure 1), so correlation and volatility are the most critical variables when considering any of these as portfolio adjuncts.
As an asset class, one could conceivably argue that the alt funds are “low-volatility” investments. In September, SPY—our market proxy—posted an annualized volatility of 12.6%. Meantime, the median standard deviation for the alt portfolios was just 7.9%. Effective hedges, among other things, tend to match the target market’s volatility.
A hedge also has to correlate negatively to its target. Much of last month’s poor alt performance can be explained by correlation. Only three of our alt portfolios correlated negatively to the broad stock market in September: The aforementioned ProShares bear fund, the Invesco DB G10 Currency Harvest Fund (DBV) and the ProShares Inflation Expectations ETF (RINF).
Alts are not for everyone. Investors uncomfortable with alternative investments often opt for low-volatility versions of their core exposures in the hope of insulating themselves from market insult. And, in normal circumstances, low-vol funds do tend to score better Sharpe ratios and suffer smaller drawdowns than their full-exposure parents. There are times, however, when low-vol funds surprise unwitting investors with large losses.
Low-vol funds, according to Akhil Lodha, founder and CEO of StratiFi, a provider of risk management technology to investment advisors, can exhibit high tail-event risk.
“Tail events are those that fall outside of the normal distribution of returns,” says Lodha. “They can happen suddenly and with little warning and they often have a large impact on portfolios. During such events, correlation tends to go to 1. This can lead to unexpected losses.”
Lodha cites the performance of the Invesco S&P 500 Low Volatility ETF (SPLV) as a prime example.
SPLV has exhibited an annualized volatility around 11% since its 2011 inception while the SPY portfolio’s annualized volatility historically runs about 14%. With figures like that, investors would likely be led to think the SPLV would be less risky than SPY. SPLV, however, acted out of character during the COVID-19 sell-off in early 2020, tumbling 35.8% against a 33.7% contemporaneous loss in the S&P 500.
“Some other funds like the iShares MSCI USA Minimum Volatility Factor ETF (USMV) performed similarly,” Lodha asserts, “so investors who are picking these funds based on volatility and hoping to reduce losses relative to the S&P 500 during such events may end up being surprised.”
Over the past two years, large-cap low-vol ETFs have fared fairly well compared with SPY. The largest of these portfolios are highlighted in Figure 2. The low-vol portfolios, for the most part, delivered better returns with less volatility than the benchmark SPY fund.
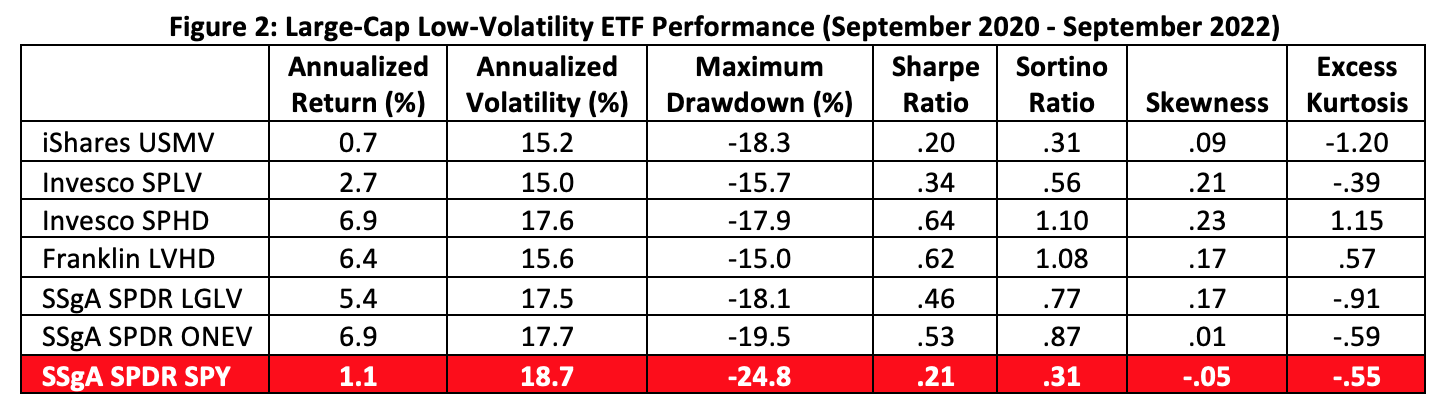
Despite appreciably diminished volatility (read: standard deviation of returns), these funds can still present investors with other risks.
Most investors, and many advisors unfortunately, assume that returns are normally distributed under a bell-shaped curve. But, in reality, returns most often exhibit skewness to one degree or another. Skewness refers to asymmetry in an investment’s return. Positive skewness indicates that the tail of a distribution curve is longer on the right side. This means the outliers of the distribution curve are farther out toward the right and closer to the mean on the left. Positive skewness tells an investor to expect frequent small losses and a few large gains while a negative skew bespeaks a complementary probability. Note that the skewness exhibited by the ETFs in Figure 2 is universally modest, though the low-vol portfolios tilt positive while the benchmark SPY fund is negative.
Then there’s kurtosis, or more definitively, excess kurtosis, which describes the “fatness” of tails in the distribution curves. A fat tail means there are lots of outlier returns. Excess kurtosis values of 1 and above or -1 and below represent significant departures from normal. Negative values indicate tails thinner than those found in normal distributions, while positive readings point to fatter tails. Note the shallowness of the left tail for USMV and the heftiness of the Invesco S&P 500 High Dividend Low Volatility ETF’s (SPHD) right tail implied by their kurtosis stats, both important signals for risk-wary investors.
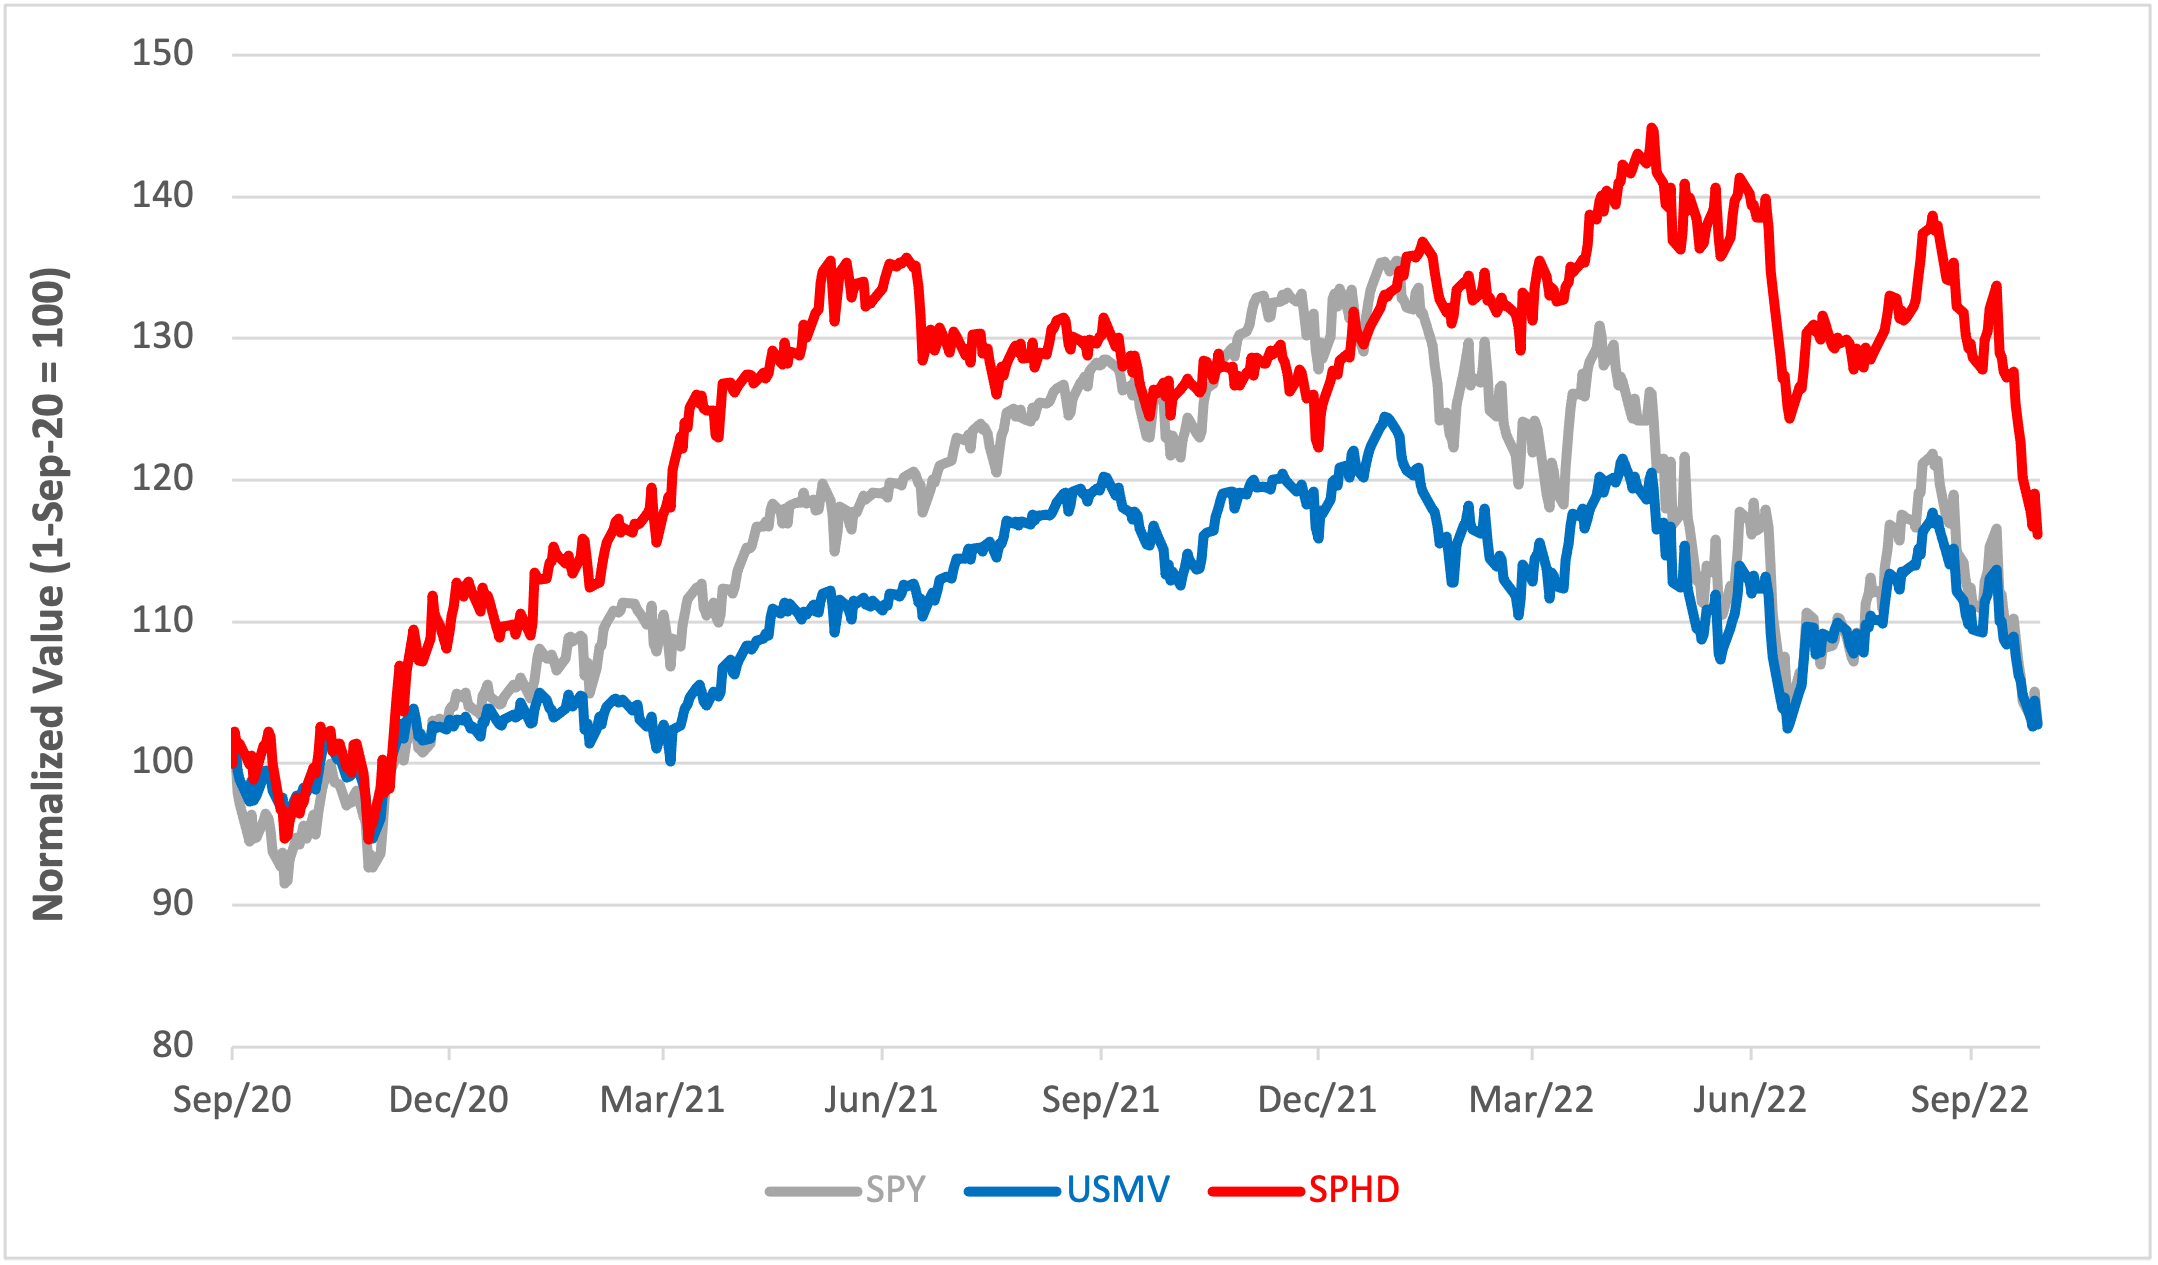
Figure 3: Large-Cap Low-Volatility ETF Performance (September 2020 - September 2022)
StratiFi’s Lodha believes metrics like skewness and kurtosis go further to explain an investor’s risk exposure than volatility alone. “Volatility averages the downside and upside moves, ignoring skewness and does not appropriately weight kurtosis, giving investors an incomplete sense of the level of risk,” he says. “When it comes to explaining risk succinctly, visualization is key. By utilizing tools like StratiFi's PRISM Rating, financial advisors can provide their clients with a clear and concise view of the risks inherent in their portfolios.”
Lodha concedes that many low-vol funds are not designed to address tail-event risk. “That may be fine as long as investors are aware of this risk and what it means for them,” he says.
So, what should investors and their advisors defer to when considering portfolio allocations? Tail risk or volatility?
It depends.
“I think the most essential and revelatory risk measure an advisor should heed is the one that is most appropriate for the objective,” says Lodha. “If an advisor's goal is to protect a portfolio from losses during a market crash, then a measure like tail-event risk would be more relevant than volatility.”
Brad Zigler is WealthManagement's alternative investments editor. Previously, he was the head of marketing, research and education for the Pacific Exchange's (now NYSE Arca) options market and the iShares complex of exchange traded funds.


