
Is the domestic stock market finally topping out? Given the vagaries of a tweet-driven U.S. trade policy, it may be too early to say definitively. One thing we can say is that the Trump Bump has collapsed.
Cast your peepers on the plot below. The red line represents the spread between the 10-year Treasury note yield and the dividend rate on the S&P 500 (the grey line is SPX, the S&P 500 itself). The spread is often thought of as a confidence indicator. Why? Well, think about it this way: As stock prices rise, their dividend yields—barring corporate actions raising payouts—naturally fall. Without a concomitant decline in yields, i.e., rising T-note prices, the yield premium rises.
The T-note’s been fairly consistent in its offer of a yield premium over stock dividends lately. Ten-year paper’s paid more than the index dividend 77% of the time over the past five years.
Notice how the yield premium shot up in November 2016? In little more than a month following the presidential election, the yield premium ballooned by 83 basis points as stocks—especially big stocks—were enthusiastically bid up in anticipation of a pro-business, anti-regulation Trumpian economy.
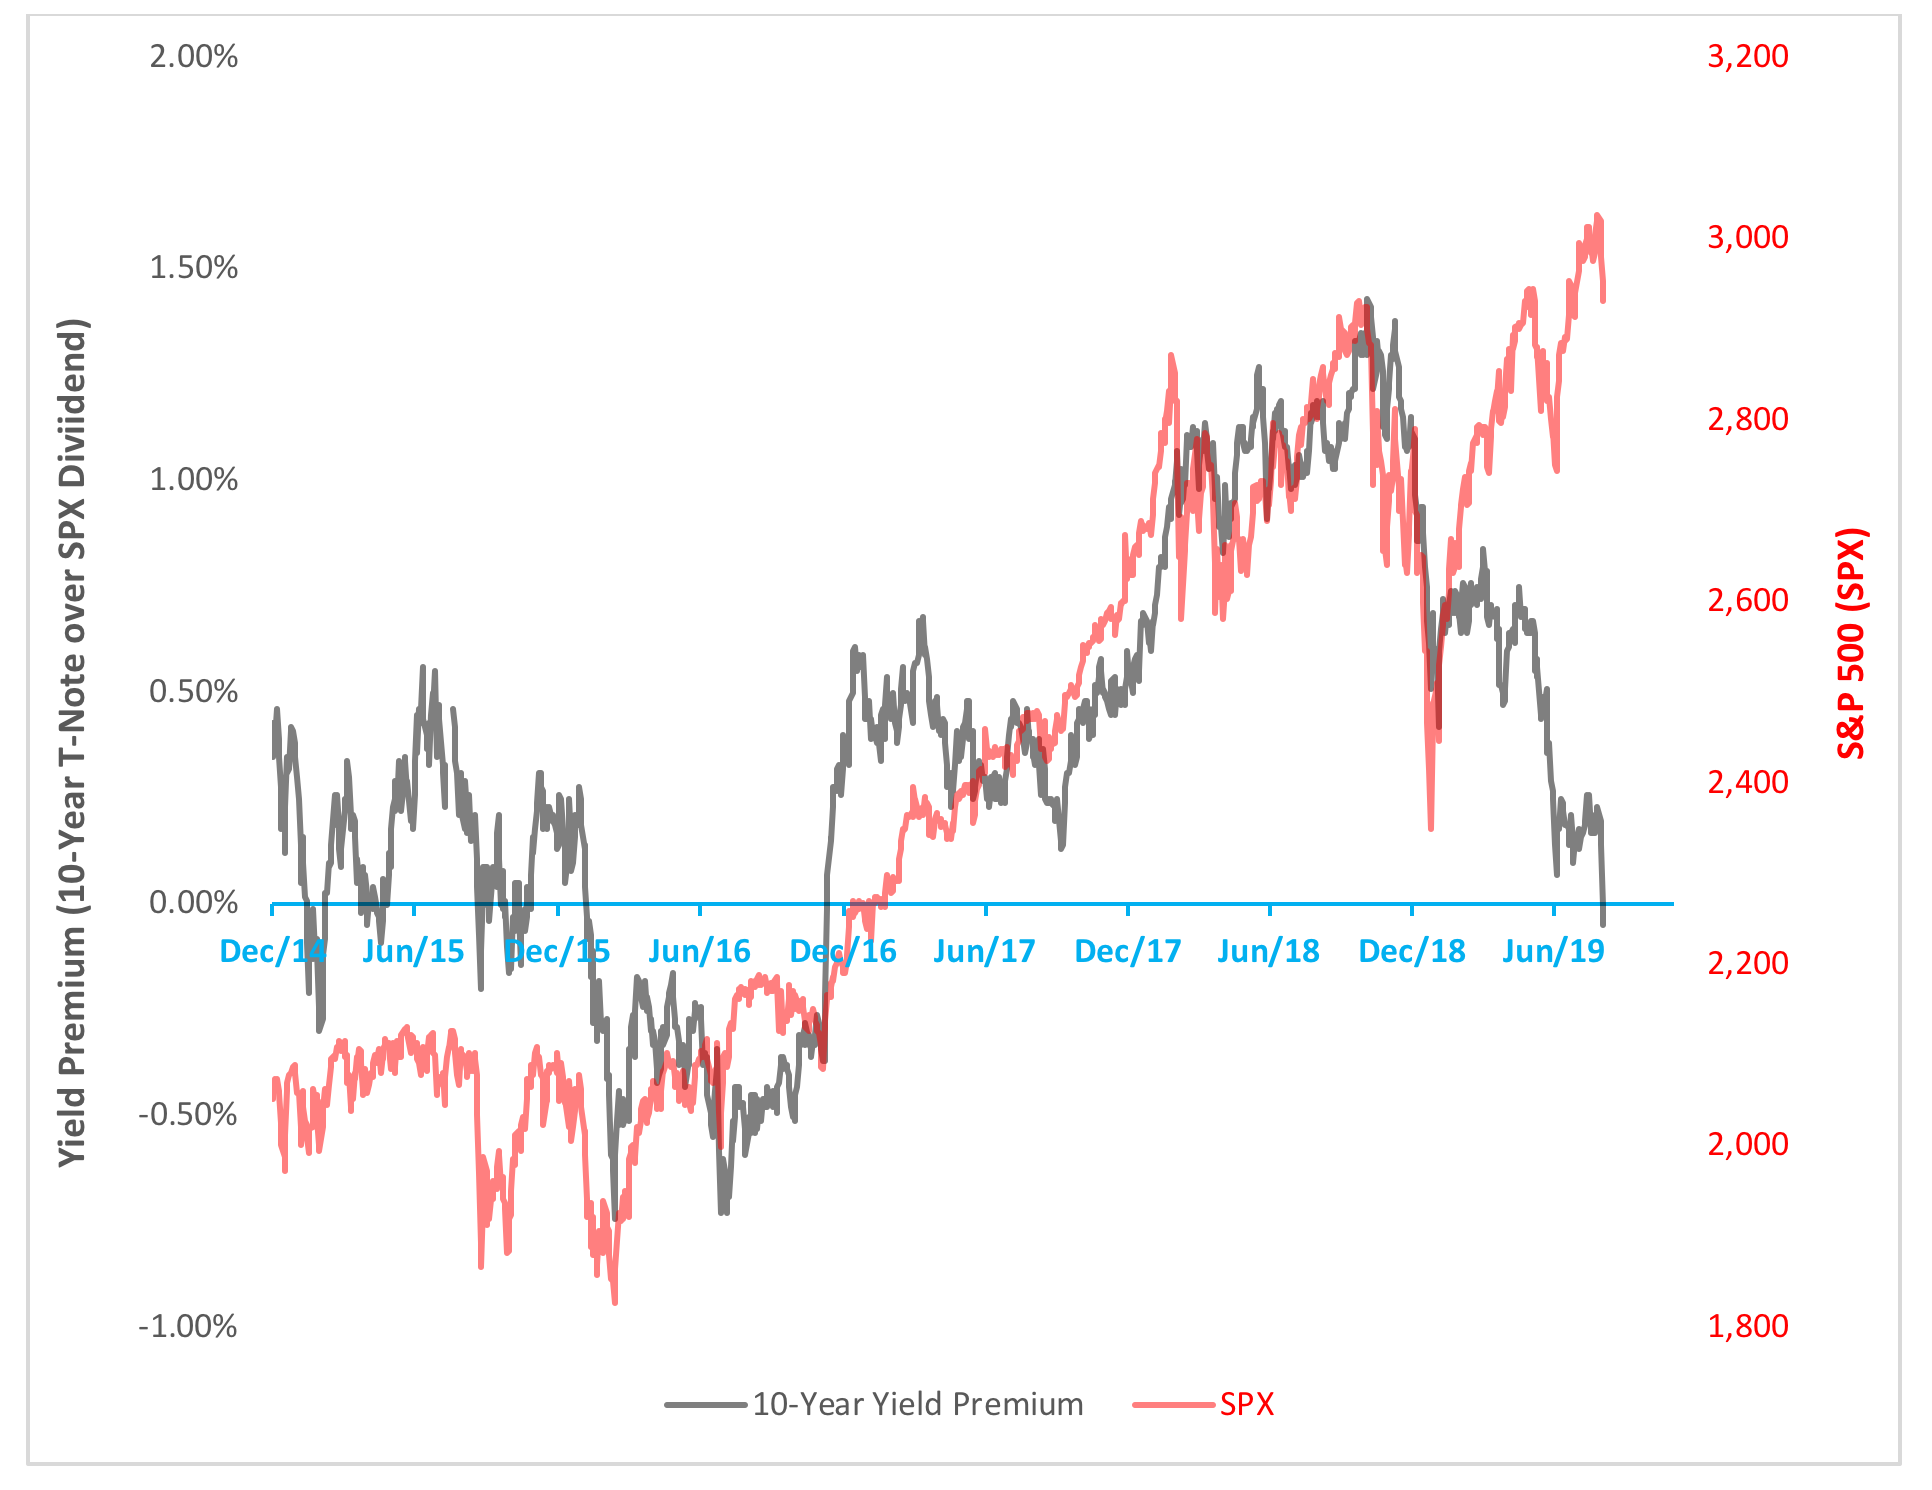
But then came the Tariff Tantrum of 2018, which plunged stocks and the yield premium into an end-of-year holiday funk. Stocks subsequently recovered—and then some—in 2019, but the yield premium’s rebound turned weak and ultimately faltered, resulting in the divergence you see above.
Finally, last week’s Fed rate cut set the bond market on fire, knocking the 10-year yield below 2% for the first time since October 2016, and with that, the yield premium went negative, just like it was immediately preceding the election.
So, has confidence in the stock market fatally slipped? There are certainly plenty of signs that we’ve reached an inflection point.
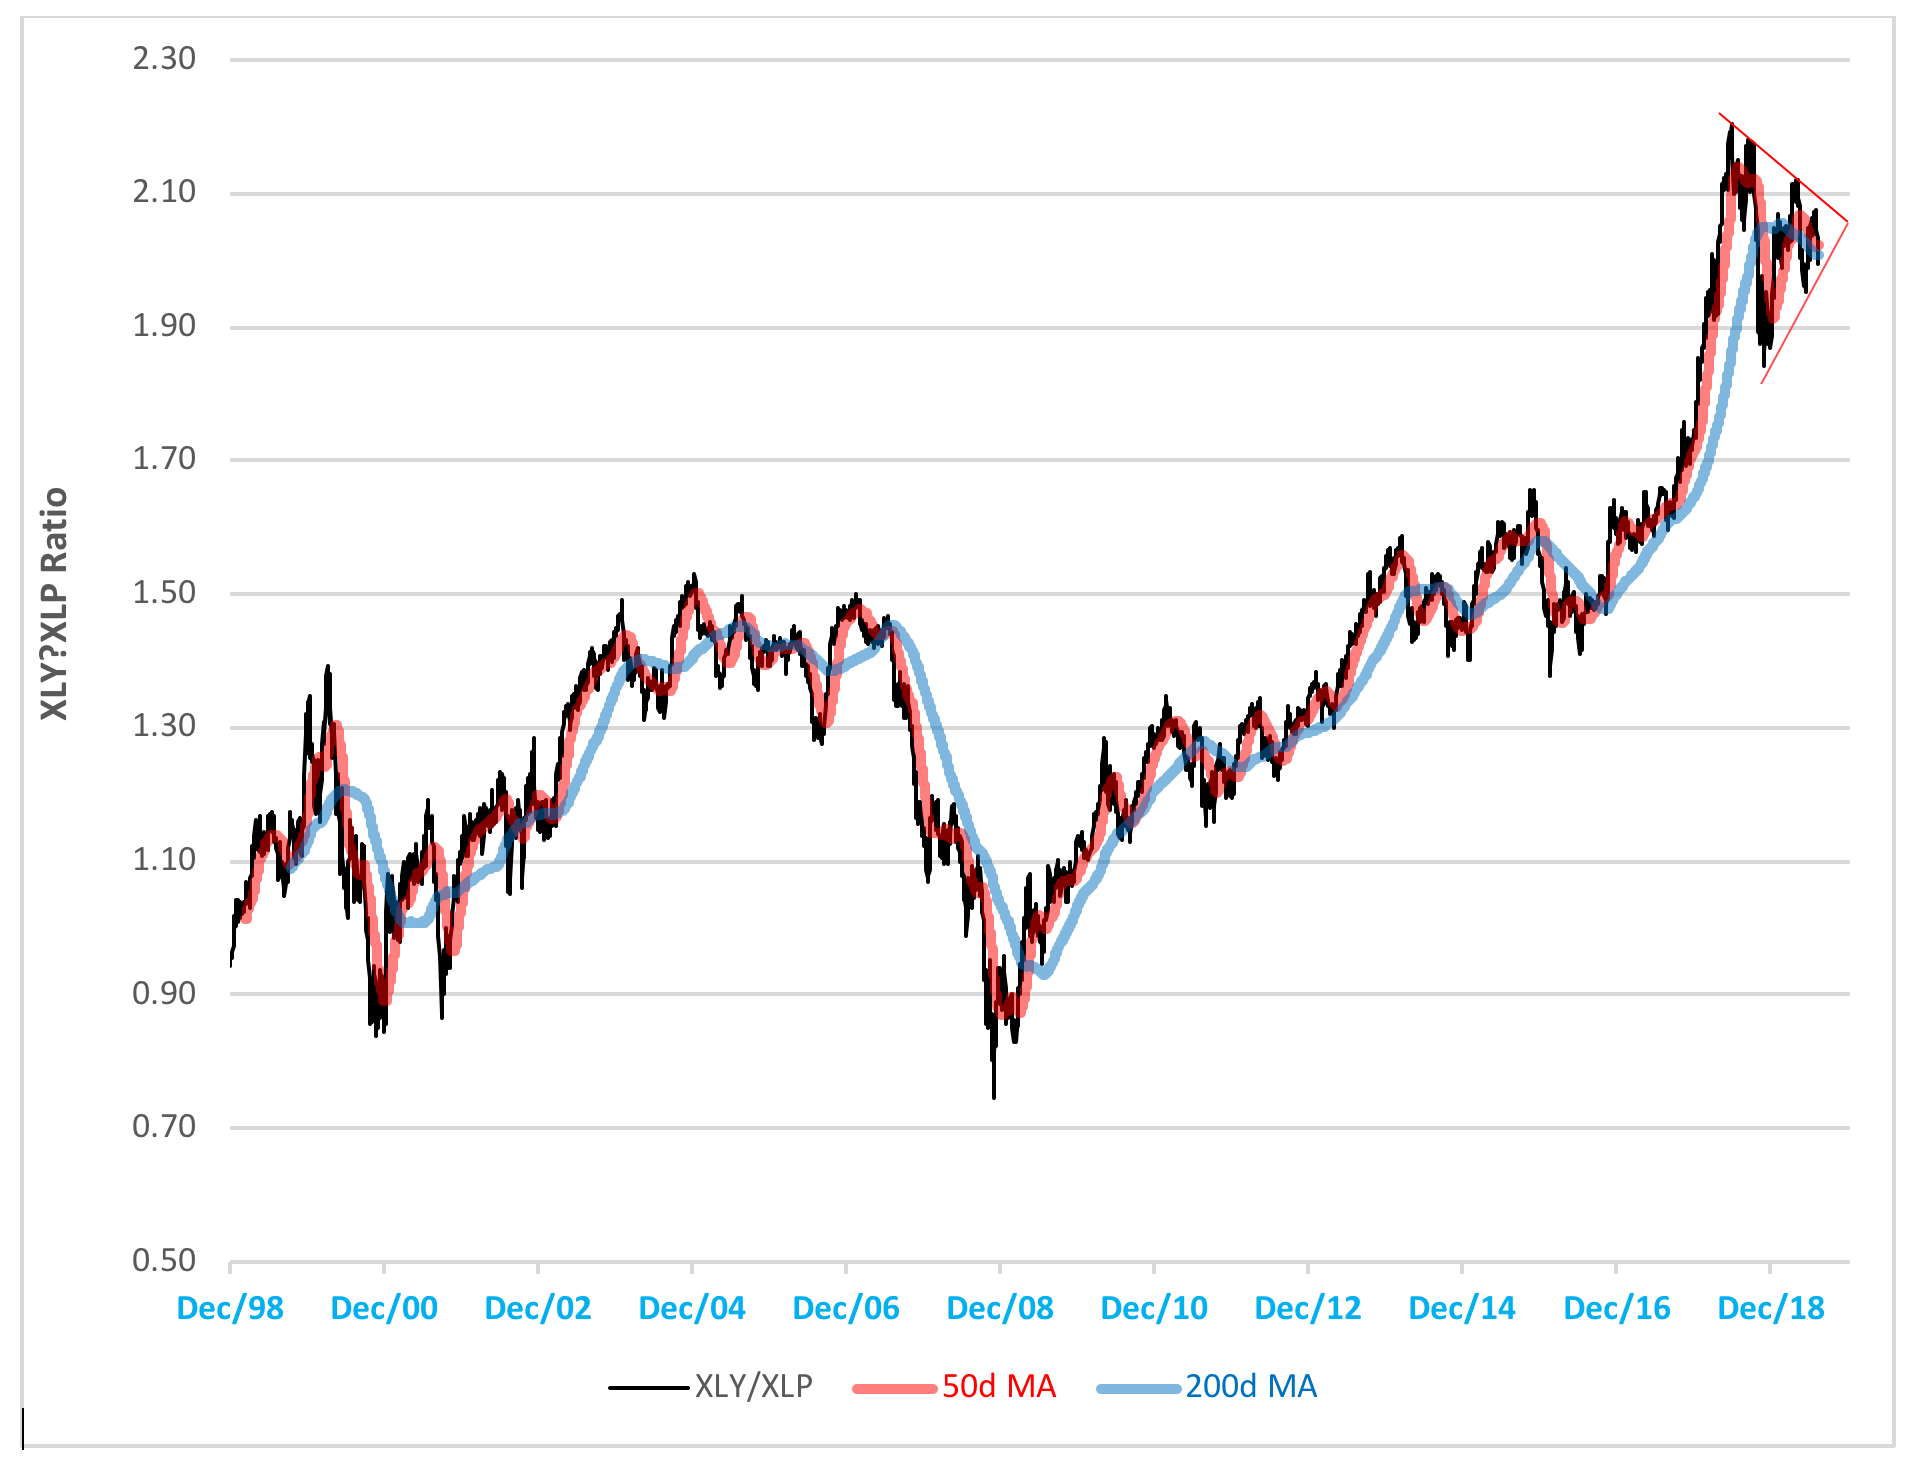
First, there’s the XLY/XLP ratio—pitting the price of the Consumer Discretionary Select Sector SPDR (NYSE Arca: XLY) against that of the Consumer Staples Select Sector SPDR (NYSE Arca: XLP)—scrunching up into a narrowing congestion area. Breakouts emerge from such patterns. BIG breakouts that either confirm the preceding trend or mark a reversal.
The consumer staples sector—made up of the makers and retailers of stuff you must buy—outperforms consumer discretionary stocks—providers of goods and services you’d like to buy if you had extra pocket money—in worsening economic times.
Then there’s market breadth measured by the ratio of the Invesco S&P 500 Equal Weight ETF (NYSE Arca: RSP) versus the capitalization-weighted SPDR S&P 500 ETF (NYSE Arca: SPY). The ratio’s been shrinking as the market’s headed higher, a warning of ever-mounting concentration risk.
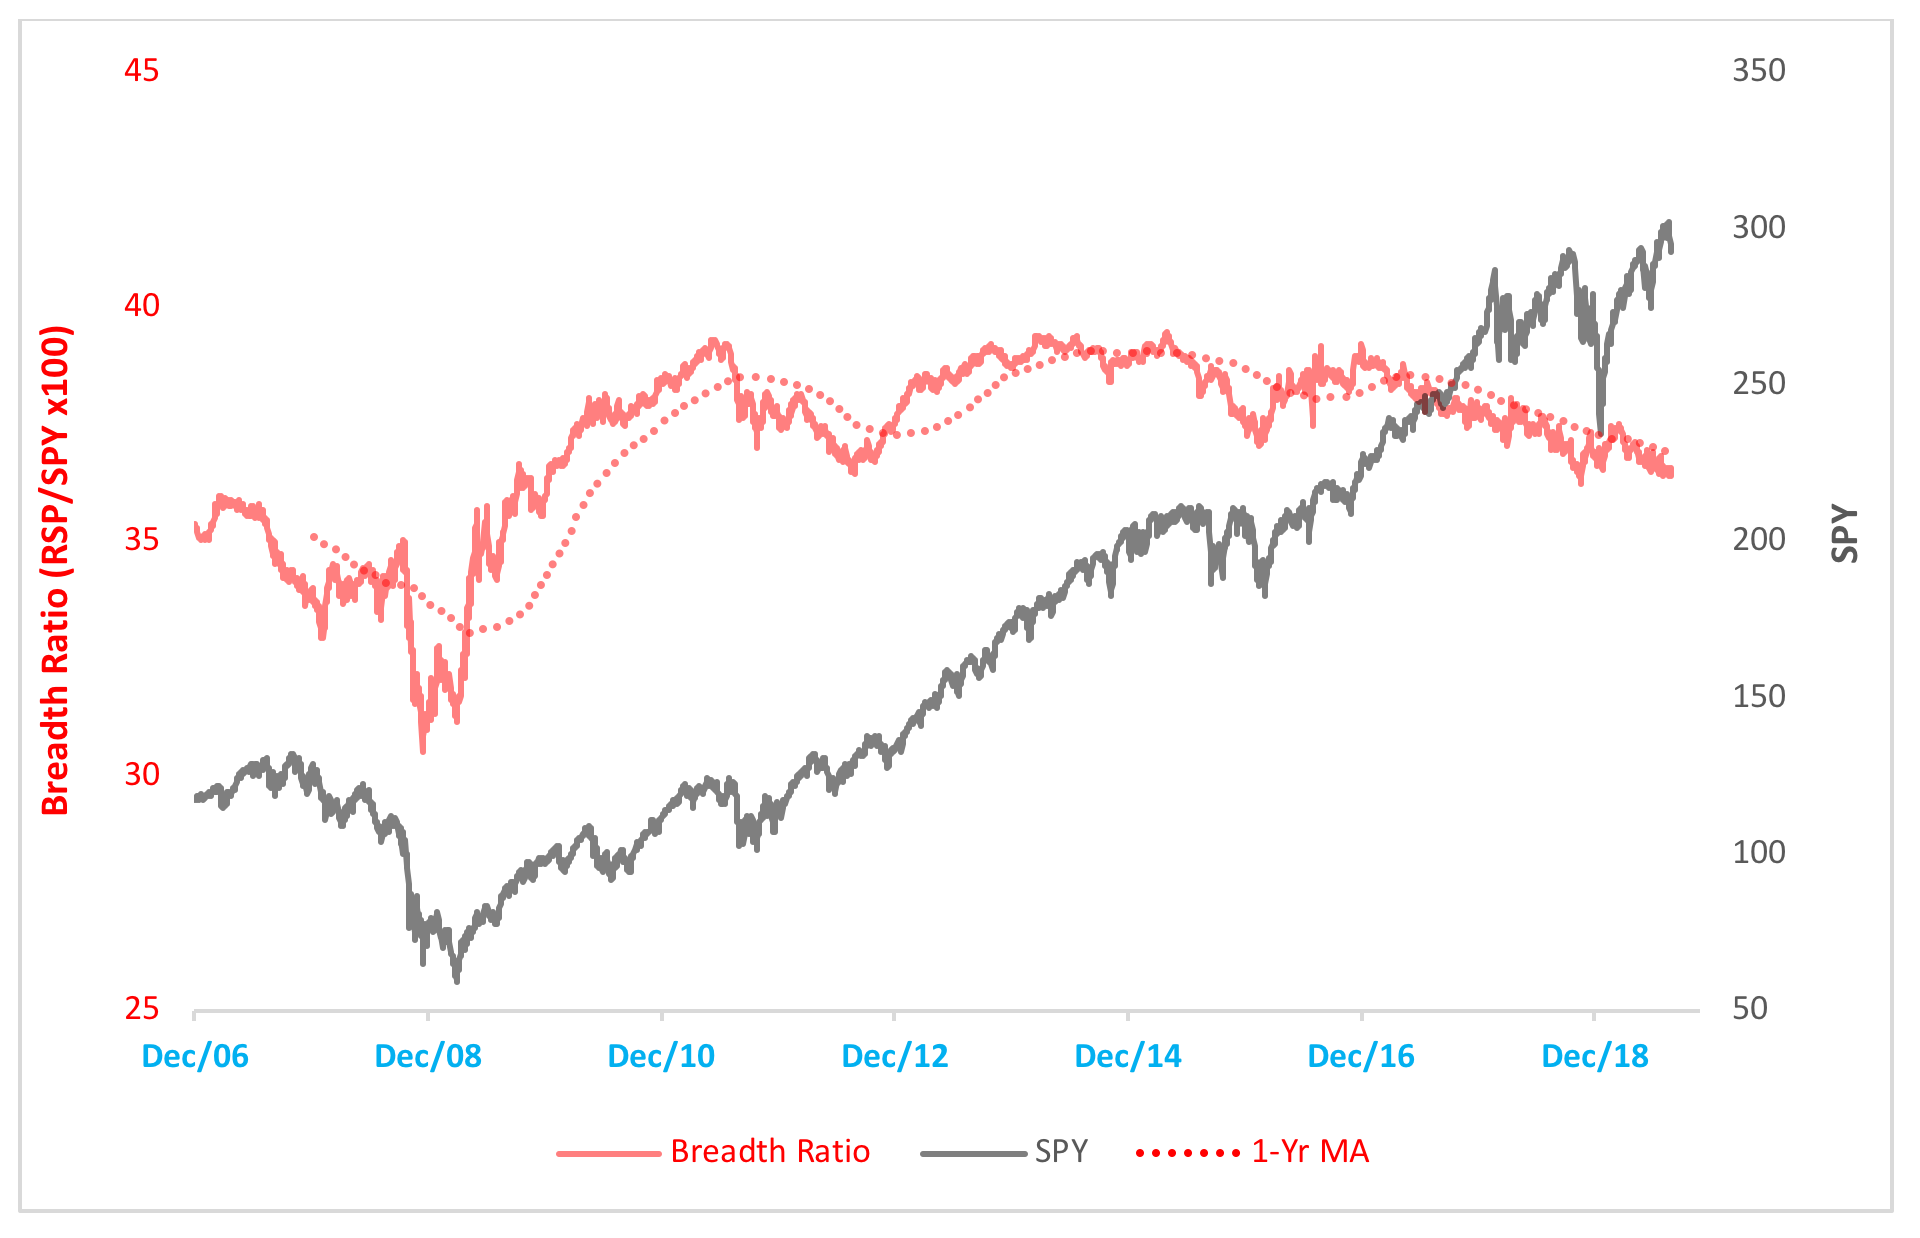
These indicators should give investors and their advisors pause, specifically the need to assess the degree of diversification in their portfolios that allows them to withstand market risks.
But don't lose sight of the forest for the trees. The charts above track daily fluctuations, or shorter-term trends. What of the long view? For that, we need to look at a monthly chart.
Mapped on a logarithmic scale below is the ratio of the S&P 500 (SPX) over the 10-year Treasury note yield. The ratio measures the long-term interest rate trend relative to stock market strength. Notice how the indicator bottomed in 1982? Then, the Federal Reserve cranked up interest rates to choke off rampant inflation. Since then, rates have generally moderated, despite several fits and starts.
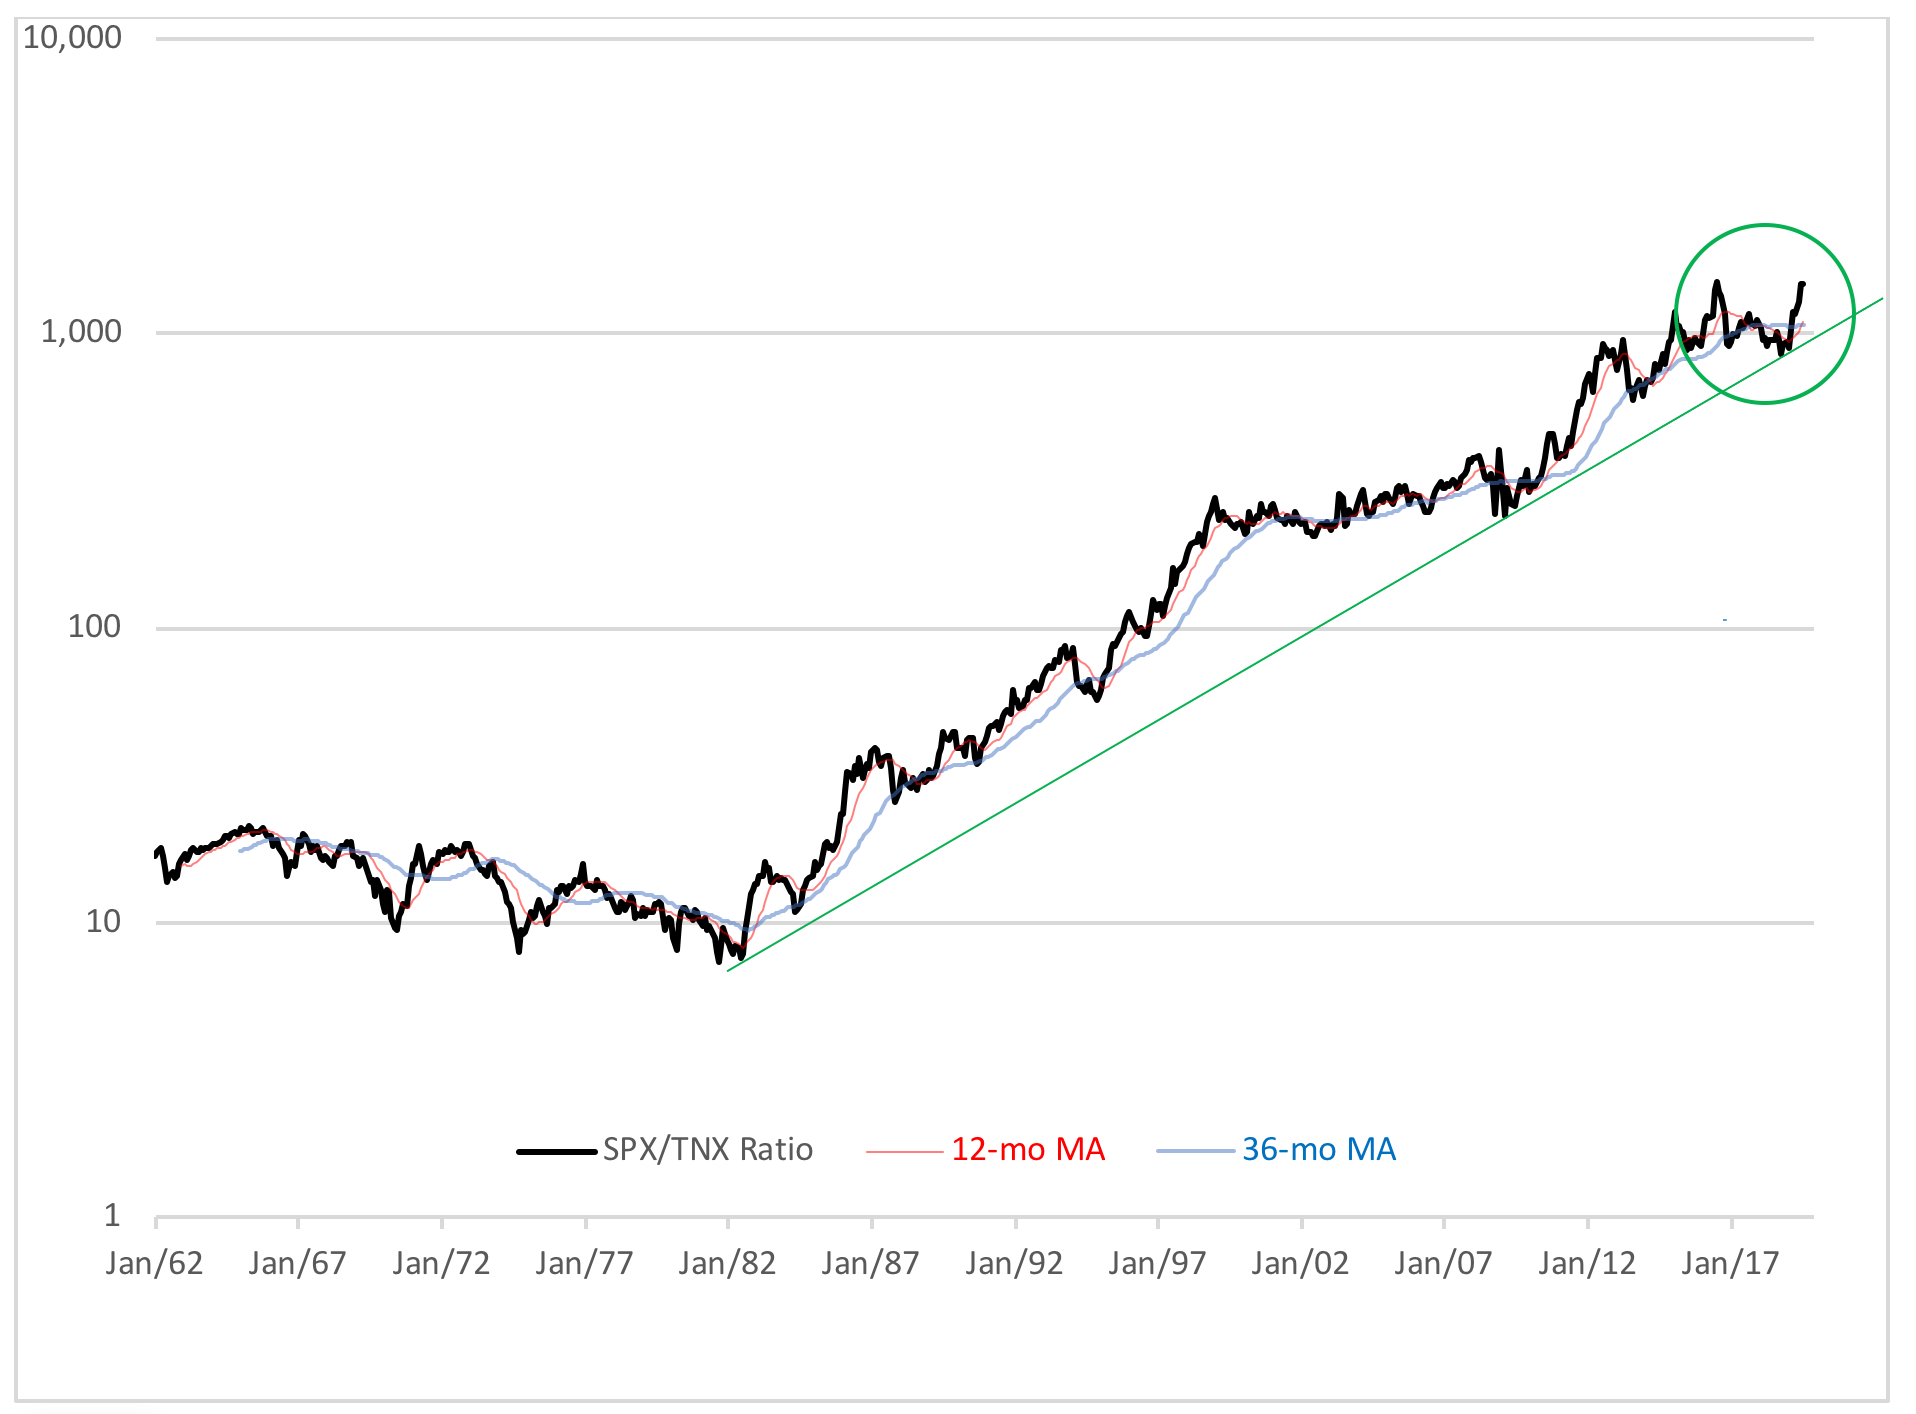
This year, the four-decade-long uptrend was sorely tested but ultimately preserved when the ratio rebounded in July. And, after last week’s Fed move, the ratio’s moved even higher, pushing the indicator close to the high established two years ago.
Does this make a continuing case for stocks?
Well, that depends on your investment horizon. For someone anticipating retirement in the near term, stocks may be too volatile now. Selective investment in defensive issues, such as the consumer staples sector, might provide some inflation protection, but fixed income still’s the go-to capital preservation investment.
For younger investors, or for institutional accounts, equities may still hold promise, provided short-term risks are effectively managed. For these accounts, staying in the forest may very well mean taking measures to prevent the trees from falling in on them.


