
Total stock market index portfolios are a good starting point for retirement investors because of their low cost, broad diversification, tax efficiency and transparency. However, they provide investors with exposure to only one factor: market beta.
As discussed in Your Complete Guide to Factor-Based Investing, academic research has uncovered several other unique sources of risk and return that have premiums proven to be persistent across long periods of time and economic regimes, pervasive around the globe, robust to various definitions, have risk- or behavioral-based explanations for why the premium should be expected to persist in the future and are implementable (survive transactions costs). These factors, being unique sources of risk, provide not only premium returns to the market, but diversification benefits, as they are not highly correlated with either market beta or each other.
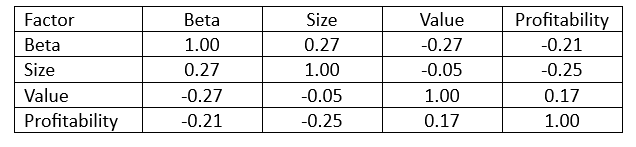
The table below, from the Ken French data library, shows the historical correlations of the beta, size, value and profitability premiums over the period 1964-2022. The low to negative correlations provide evidence of the diversification benefits.
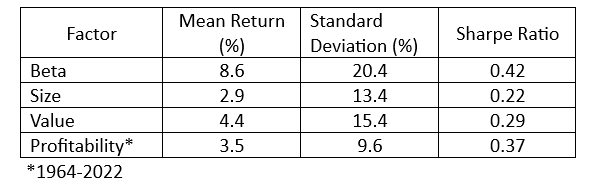
Mathieu Pellerin, author of the April 2023 study How Targeting the Size, Value, and Profitability Premiums Can Improve Retirement Outcomes, examined how adding exposures to those three premiums can improve the odds of achieving financial goals, specifically not running out of money in retirement and meeting a bequest goal. The following table shows the risk and return profiles of the four premiums. The data, from the Fama-French index of the Ken French library, covers the period 1927-2022 (with the exception of the profitability premium, for which data is only available since 1964).
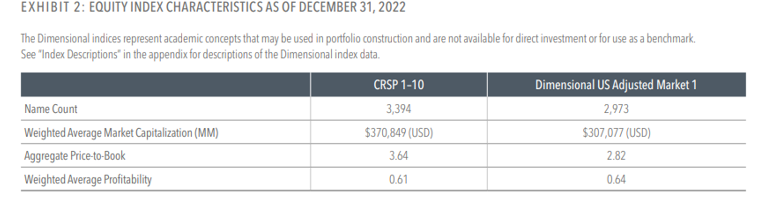
Pellerin studied the impact of pursuing these premiums on retirement outcomes by running a horse race between a market portfolio (CRSP 1-10 Index) and a systematic portfolio with moderate emphasis on the size, value and profitability premiums (represented by the Dimensional US Adjusted Market 1 Index). As seen in the table below, the Dimensional US Adjusted Market 1 Index has a lower market cap (a size tilt to small stocks), a lower price-to-book ratio (a tilt to value stocks) and a higher weighted average profitability (a tilt to more profitable companies).
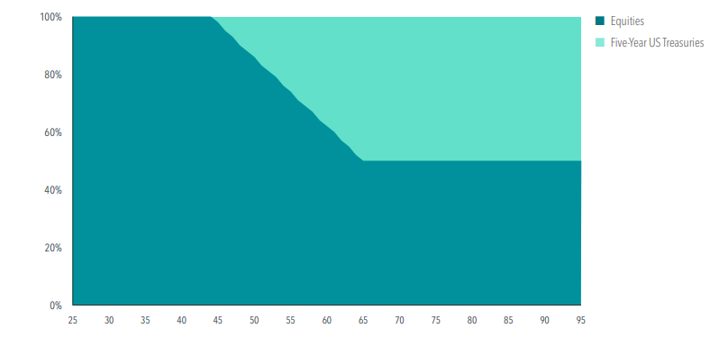
Both portfolios are part of a glide path (typical of target date funds) that begins with 100% equity allocations at age 25, starts transitioning toward fixed income at 45 and reaches an equity landing point of 50% at 65. The bond portion is allocated to five-year Treasuries.
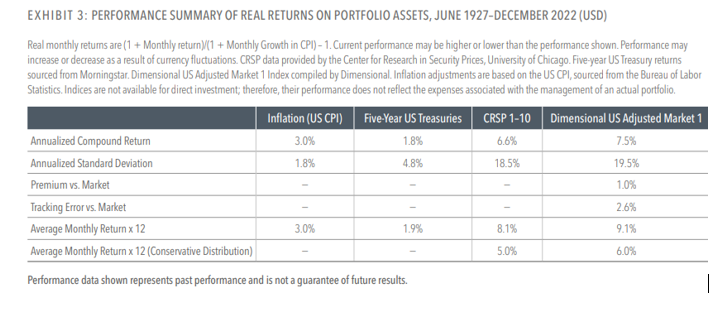
To test the impact of adding the tilts to these three factors, Pellerin ran two sets of simulations. The first bootstrapped the historical data. This setup assumed that the real expected stock return equaled the historical average of 8.1% per year. The second set of simulations (a more conservative distribution) assumed that the real expected equity return was 5%, which corresponded to the fifth percentile of the estimated distribution of the average historical return. For each simulated lifecycle, he drew 70-year (840-month) return histories from the sample. In every simulated history, retirement spending was set at 4% of the initial balance at retirement and spending stayed constant in real terms through retirement. The following table summarizes the historical returns of bonds and stock indices, including both the historical and conservative mean for stock returns:
Results Over the Lifecycle
The following exhibit shows the 10th, 50th and 90th percentiles of assets at the beginning of retirement. Under the historical distribution, premium targeting increased median assets from $2.09 million to $2.55 million, a 22% increase. Under the conservative distribution, median assets ($1.07 million and $1.28 million) were substantially lower, but premium integration still resulted in a 20% increase in median initial assets. For those individuals with a bequest desire, these findings show that the size of bequests increased by targeting the three factors.
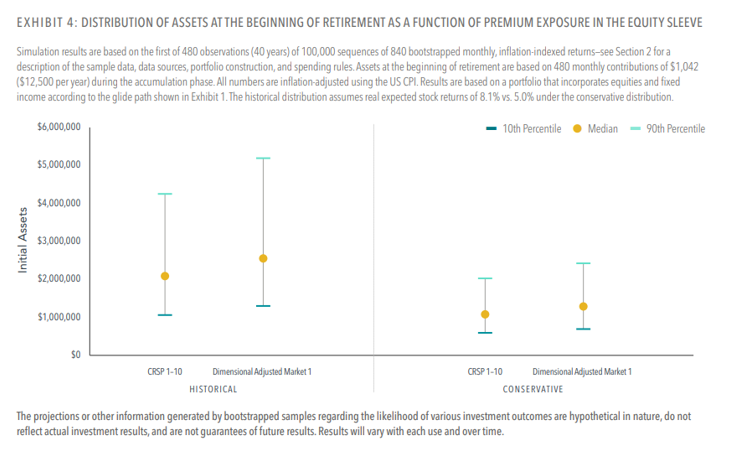
Pellerin also found that the benefits extended to the 10th percentile of outcomes. Under the historical and conservative distributions, premium integration increased the 10th percentile of assets at the beginning of retirement by 21% and 18%, respectively. He explained that this result is important: “Since premium targeting introduces tracking error and slightly increases the variance of the equity portfolio, one could expect outcomes for the premium-focused portfolio to be more dispersed, with both a lower 10th percentile and a higher 90th percentile. Our results instead suggest that a moderate emphasis on the premiums increases initial retirement assets even under adverse scenarios.”
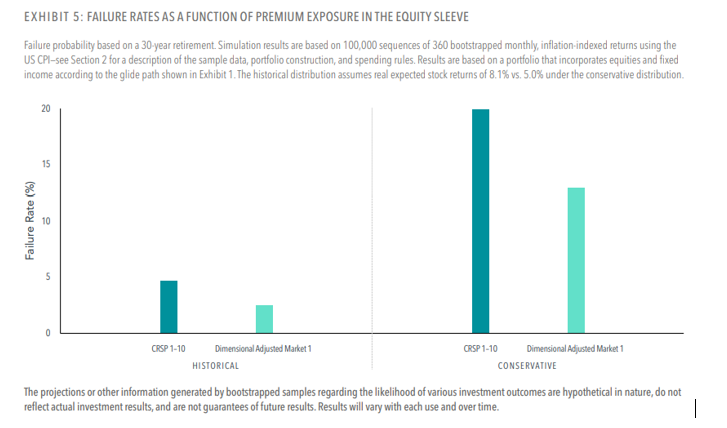
Further, and perhaps most importantly, Pellerin found that using historical return assumptions premium integration reduced the failure rate from 4.7% to 2.5%. And the benefits were even larger under the conservative distribution, as the failure rate fell from 19.9% to 12.9%.
Pellerin’s findings led him to conclude: “A systematic and integrated focus on the size, value, and profitability premiums can improve expected returns while preserving the benefits of broad diversification. … Even moderate exposure to the premiums can significantly improve retirement outcomes.” He added: “It is never ‘too late’ to start targeting the premiums in the equity sleeve. By switching to an equity portfolio emphasizing size, value, and profitability from age 65 to 95, the investor would still expect to benefit from lower failure rates because failure rates are driven by the ratio between spending and assets rather than the absolute level of initial assets.”
Investor Takeaways
Investors willing to accept even moderate levels of tracking variance can improve the odds of achieving their financial objectives of not outliving their assets or leaving a bequest. His findings are applicable to the design of retirement asset allocations, target date funds and managed accounts.
With that said, pursuing the size, value and profitability premiums within equities is not a free lunch, as extended bouts of underperformance are not only possible but likely, and can try the patience of even experienced investors. However, avoiding all tracking error is not a free lunch either (it’s likely an expensive one), as market portfolios lead to lower retirement assets, higher failure rates and smaller bequests on average than portfolios that are more diversified in their sources of risk and return.
For those interested in learning more about how adding unique sources of risk can improve retirement outcomes, I recommend reading the 2018 edition of Reducing the Risk of Black Swans, which includes discussion on the impact of adding alternative investments.
Larry Swedroe has authored or co-authored 18 books on investing. His latest is Your Essential Guide to Sustainable Investing. All opinions expressed are solely his opinions and do not reflect the opinions of Buckingham Strategic Wealth or its affiliates. This information is provided for general information purposes only and should not be construed as financial, tax or legal advice.


