
Sentiment—the mood investors exhibit toward a particular market or asset—can be an important determinant of investment performance.
Investors who exhibit relatively high sentiment tend to be overconfident and engage in excessive trading, resulting in subpar investment performance—they are acting on “noise” and emotions. Such activity can lead to mispricing, especially in less liquid stocks, which are more subject to limits to arbitrage (the risks and costs of shorting). Eventually, any mispricing would be corrected when the fundamentals are revealed. The result is that investor sentiment can be a contrarian predictor of stock market returns.
Malcolm Baker and Jeffrey Wurgler constructed an investor sentiment index based on five metrics: the value-weighted dividend premium (the difference between the average market-to-book ratio of dividend payers and nonpayers), the first-day returns on initial public offerings (IPOs), IPO volume, closed-end fund discount and equity share in new issues. Originally, the Baker-Wurgler index included a sixth metric; however, the NYSE turnover ratio was dropped in the newest update. (Data is available at Wurgler’s New York University web page.)
Does investor sentiment (the psychology of crowds) affect stock prices, leading to further mispricings? The argument against this possibility is that any effects caused by sentiment should, in theory, be eliminated by rational traders seeking to exploit the profit opportunities created by mispricings. However, if there are limits to arbitrage, rational traders cannot fully exploit such opportunities—and sentiment effects become more likely.
The research on investor sentiment, including the 2012 studies “Global, Local, and Contagious Investor Sentiment” and “The Short of It: Investor Sentiment and Anomalies,” and the 2020 study “Investor Sentiment: Predicting the Overvalued Stock Market,” largely focuses on overall market sentiment and found that:
- Investor sentiment plays a significant role in international market volatility and generates return predictability of a form consistent with the correction of investor overreaction.
- Total sentiment is a contrarian predictor of country-level market returns—high investor sentiment predicts low future returns and vice versa.
- Sentiment has greater effects on hard-to-arbitrage (due to greater costs and greater risks) and hard-to-value stocks (small-cap, high return volatility, growth and distressed stocks)—stocks that exhibit high “sentiment beta.”
New Evidence
Guohao Tang, Yiyong Wu and Fuwei Jiang, in their September 2022 study “A New Firm-level Investor Sentiment,” created a measure of firm-level investor sentiment (FIS). Instead of using market proxies, such as mutual fund flows, closed-end fund discounts, first-day returns on initial public offerings and IPO volume, FIS measures how far an individual stock’s market beta diverged from that of its peer industry firms (using Fama-French 49-industry classification).
The authors’ FIS enabled them to reveal exaggerated beliefs among individual stocks. They used the change in beta, calculated as the difference between the stock’s current and last month’s beta, to measure the attention/sentiment shift. Their hypothesis was that stocks actively traded by optimistic investors are likely to be driven by speculative demand, which leads to overpricing—as long as arbitrageurs are constrained from betting against them (there are limits to arbitrage). Subsequently, when the true fundamental information is released, previous speculative buying is subdued or even reversed, and the high-sentiment stocks underperform due to price reversal.
Their data sample included NYSE/AMEX/Nasdaq common stocks over the period 1971 to 2020. Here is a summary of their key findings:
There was high retail attention among stocks with high investor sentiment—high sentiment indicated significant increases in the net buying flow of investors, resulting in a temporary price pressure. Subsequently, that increase in net buying slowed down and prices tended to revert—only 18.7% (19.6%) of the stocks in the highest (lowest) month FIS decile portfolio continued to be in the highest (lowest) decile portfolio of FIS one month later. In addition, more than one-third of the highest decile FIS stocks were regrouped into the lowest decile one month later.
FIS was not correlated with common firm characteristics (factors), and surprisingly, it seldom comoved with idiosyncratic volatility (IVOL) and maximum daily returns (MAX), implying that FIS is unlikely to be driven by investors’ lottery demand.
Suggesting that attention is a prerequisite for investors to generate cross-sectional sentiment, stocks with high investor sentiment were accompanied by high trading volume. The negative cross-sectional predictability of investor sentiment was stronger for stocks with high abnormal trading volumes.
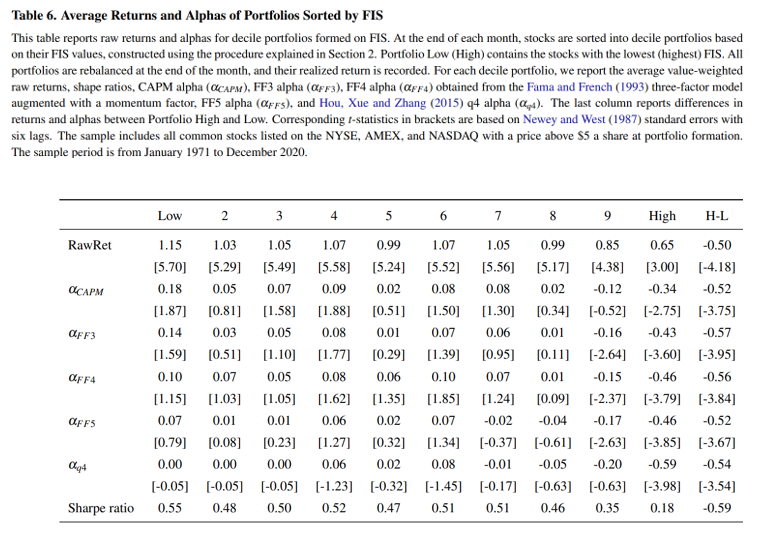
Stocks with high FIS generated substantially lower future returns than those with lower FIS. The top FIS decile on average underperformed the bottom decile by 0.50 percentage point (t-stat = 4.15) in the following month—a strategy that sells stocks with the highest FIS and buys those with the lowest generated a 6% annual return.
The long-short FIS strategy produced statistically significant abnormal alphas across various asset pricing models, with the majority of the alphas attributed to the underperformance of firms with the highest FIS. The monthly alphas of long-short portfolios under the CAPM (market beta factor), Fama-French three-factor model (beta, size and value), Carhart four-factor model (beta, size, value and momentum), Fama-French five-factor model (beta, size, value, profitability and investment), and Hou, Xue and Zhang q4-factor model (beta, size, profitability and investment) were ‑0.52% (t-stat = -3.75), - 0.57% (t-stat = -3.95), -0.56% (t-stat = -3.84), -0.52% (t-stat = -3.67) and -0.54% (t-stat = -3.54), respectively.
Employing institutional ownership to distinguish noise traders from rational arbitrageurs, the predictability of cross-sectional sentiment was both negative and significant for stocks with low levels of institutional shareholdings, but the significance of the predictability weakened for stocks with high levels of institutional shareholdings. (Note that institutions provide the majority of shares available to borrow, allowing shorting to occur. Their presence [absence] reduces [increases] borrowing costs and the limits to arbitrage.)
Tang, Wu and Jiang also examined the relationship between safe versus speculative stocks and FIS. They used five different measures to proxy for the speculative feature of a stock: firm size (SIZE), stock return standard deviation (RetStd), illiquidity (ILLIQ), idiosyncratic volatility (IVOL) and earnings-to-book ratio (E/BE), with smaller, more volatile, more illiquid firms with higher idiosyncratic volatility and firms with low profitability being more speculative. Breaking each group into deciles, they found that there was a much wider FIS range among all five speculative groups, providing strong evidence that FIS reflects firm-level investor sentiment.
Their findings led Tang, Wu and Jiang to conclude that there is “a negative relationship between a stock’s FIS and future returns. The return difference between the high- and low-FIS portfolios is economically large, statistically significant and not explained by common risk factors. These results provide evidence that firm-level investor sentiment can negatively predict future return.” They added: “The negative sentiment-return relation comes mainly from the underperformance of firms with the highest investor sentiment.” That result is due to it being easier for arbitrageurs to correct undervaluation than overvaluation (which results from high sentiment).
Investor Takeaways
Due to limits to arbitrage, investors with the most optimistic views about a stock exert the greatest effect on the stock’s price. That is because their views are not counterbalanced by the valuations of the relatively less optimistic investors who are inclined to take no position if they view the stock as undervalued, rather than take a short position.
When the most optimistic investors are too optimistic and overvalue the stock, overpricing results. In contrast, underpricing is less likely. Thus, the takeaway for investors is to avoid being a noise trader. Don’t get caught up in following the herd over the investment cliff. Stop paying attention to prognostications in the financial media. Most of all, have a well-developed, written investment plan. Develop the discipline to stick to it, rebalancing when needed and harvesting losses as opportunities present themselves.
Larry Swedroe is head of financial and economic research for Buckingham Wealth Partners and Buckingham Strategic Wealth, a community of more than 140 independent registered investment advisors throughout the country.
For informational and educational purposes only and should not be construed as specific investment, accounting, legal, or tax advice. Certain information is based upon third party data which may become outdated or otherwise superseded without notice. Third party information is deemed to be reliable, but its accuracy and completeness cannot be guaranteed. Indices are not available for direct investment. Their performance does not reflect the expenses associated with the management of an actual portfolio nor do indices represent results of actual trading. Information from sources deemed reliable, but its accuracy cannot be guaranteed. By clicking on any of the links above, you acknowledge that they are solely for your convenience, and do not necessarily imply any affiliations, sponsorships, endorsements or representations whatsoever by us regarding third-party websites. We are not responsible for the content, availability or privacy policies of these sites, and shall not be responsible or liable for any information, opinions, advice, products or services available on or through them. The opinions expressed by featured authors are their own and may not accurately reflect those of Buckingham Strategic Wealth® or Buckingham Strategic Partners®, collectively Buckingham Wealth Partners. Neither the Securities and Exchange Commission (SEC) nor any other federal or state agency have approved, determined the accuracy, or confirmed the adequacy of this article. LSR-22-403.


