
The Merriam-Webster Dictionary defines a meme as “an amusing or interesting item (such as a captioned picture or video) or genre of items that is spread widely online especially through social media.” Memes have gained increasing relevance as the internet and social media have grown. They allow people to rapidly spread ideas as the multiplicative effect of sharing posts can cause them to “go viral.” In terms of investing, a “meme stock” refers to a company that has gained viral popularity due to heightened social sentiment. Similarly, the development of chat rooms and discussion boards in the late 1990s allowed investors to promote stocks, contributing to the dot-com bubble that eventually burst in spectacular fashion in March 2000.
Unfortunately, investors didn’t learn from that experience. The meme stock phenomenon reemerged in 2020 via the Reddit forum wallstreetbets, where legions of small but active retail stock traders shared strategies and coordinated their investment firepower. The biggest target was GameStop, a distressed video game retail company with shares widely shorted by institutional traders. Yet meme stock traders, coordinating through Reddit, bought and held, and the share price rose “as much as 100x over the course of several months as members of its meme community crafted a spectacular short squeeze,” according to Investopedia’s entry on meme stocks. Meme stocks became so popular that in March 2021, one asset manager created a meme stocks exchange traded fund: VanEck Social Sentiment (BUZZ). More on that later.
Is meme investing a good idea? Let’s review the research on the role of investor sentiment in stock returns.
Investor Sentiment
We can define investor sentiment as the propensity of individuals to trade on noise and emotions rather than facts. Sentiment represents investors’ beliefs about future cash flows that the prevailing fundamentals cannot explain. Research—including the 2006 study “Investor Sentiment and the Cross-Section of Stock Returns,” the 2012 studies “Global, Local, and Contagious Investor Sentiment” and “The Short of It: Investor Sentiment and Anomalies,” and the 2018 study “Investor Sentiment: Predicting the Overvalued Stock Market”—has found that such activity can lead to mispricing, especially for hard-to-arbitrage stocks and during periods of high investor sentiment. Eventually, any mispricing would be expected to be corrected when the fundamentals are revealed, making investor sentiment a contrarian predictor of stock market returns.
The research has also found that overpricing is more prevalent than underpricing because investors with the most optimistic views about a stock exert the greatest effect on the price; their views are not counterbalanced by the relatively less optimistic investors inclined to take no position if they view the stock as undervalued, rather than a short position. Thus, when the most optimistic investors are too optimistic, overpricing results. Underpricing on sentiment is less likely.
Research, including the 2009 study “Do Retail Trades Move Markets?,” the 2014 study “Industry-Based Style Investing” and the 2018 study “Behavioral Biases in the Corporate Bond Market,” has found that retail investors tend to be the “noise traders” or “dumb money” and trade on sentiment. Examples of times when investor sentiment ran high are the 1968-69 electronics bubble, the biotech bubble of the early 1980s and the dot-com bubble of the late 1990s. Sentiment fell sharply, however, after the 1961 crash of growth stocks, in the mid-1970s with the oil embargo and in the crash of 2008. On the other hand, institutional investors are seen as “smart money” and tend to trade against the stocks with high investor sentiment.
Institutional Ownership
Zhenyu Gao, Jiang Luo, Haohan Ren and Bohui Zhang, authors of the September 2022 paper “Institutional Investors and Market Sentiment: A Revisit,” used a comprehensive data set of institutions’ long and short positions to examine their trading patterns during periods of high investor sentiment (using the Baker and Wurgler measure of investor sentiment). They constructed a sample of U.S. institutional investors’ quarterly 13-F filings and the Baker-Wurgler (BW) sentiment measure over the period from the second quarter of 1980 to the fourth quarter of 2018. The BW sentiment measure contains five metrics: the dividend premium (the difference between the average market-to-book ratio of dividend payers and nonpayers), the closed-end fund discount, number of IPOs, first-day returns on IPOs and the equity share in new issues. (Data is available at Jeffrey Wurgler’s New York University webpage.) They also used two other measures of sentiment from the literature, Investor Sentiment Aligned: A Powerful Predictor of Stock Returns and Manager Sentiment and Stock Returns, both of which tended to move together with the BW measure. They found that, on average, institutional investors bet against sentiment traders and correct overvaluations, making the market more efficient. “The evidence is consistent with the notion that institutional investors cope with market sentiment rationally; when market sentiment is at a high level, they, on average, sell (or buy less), especially for high-volatility stocks”—those meme stocks.
Investor emotions and enthusiasms have played a major role in driving stock prices. However, the COVID-19 pandemic may have caused such emotional trading to reach a historic peak as groups of shut-in amateur investors piled into the fun-seeking meme stocks with little regard for economic fundamentals. What has been the result?
Meme Stock Performance
Thanks to the research team at Counterpoint Mutual Funds, we can examine the relative performance of the meme stocks. Counterpoint defined meme stocks as those that have more than 5% of their market capitalization traded daily (more than 100% turnover per month). The following charts show the performance of the high-sentiment/attention stocks relative to the performance of the rest of the market, with portfolios rebalanced monthly, over the periods 1998-2001 and January 2018-October 2021.
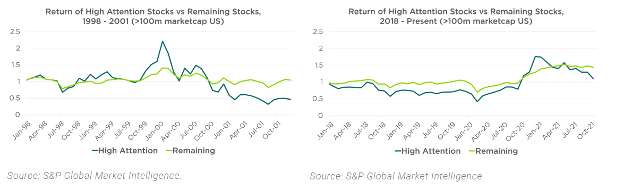
As you can see, the early 2020s basically mirror the peak of the dot-com bubble.
The following chart shows the returns of the meme stocks, with monthly rebalancing, from November 1991 through October 2022. Over the period, the high-attention meme stocks returned -11.89% per annum, underperforming the nonmeme stocks, which returned 9.64% per annum, by 21.65 percentage points per year.
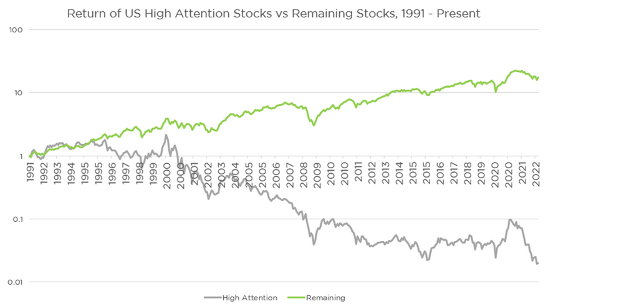
The chart demonstrates that while attention-getting meme stocks may provide investors with a thrill to hold as they become objects of interest, in the long run reaching meme status has been a bad omen for future returns. As you can see from the trajectory of the blue line, buying “high-attention” meme-like stocks as attention is peaking has a negative expectation. The green line, meanwhile, shows “remaining” stocks. Their historical returns have been much more positive than those of their high-attention cousins.
All the above data doesn’t even include trading costs, which are likely to be high because meme stocks tend to be not only more volatile but also less liquid. To see how a live fund of meme stocks performed, we will examine the performance of the aforementioned VanEck Social Sentiment ETF (BUZZ), which we believe encapsulates meme stocks and is a proxy for how meme stocks perform.
BUZZ Stocks
Since BUZZ is relatively new, we used the backtest tool at Portfolio Visualizer to examine how the stocks would have performed over time. According to Portfolio Visualizer’s calculations (more fully detailed on its website), from its inception in April 2021 through December 2021, the fund lost 3.5% and thus underperformed Vanguard’s S&P 500 ETF (VOO), which returned 21.1%, by 24.6 percentage points. In 2022, through November 16, BUZZ lost 40.6%, underperforming VOO, which lost 15.8%, by 24.8 percentage points. Noting that BUZZ has an expense ratio of 0.75%, the lesson is that underperformance doesn’t come cheap; you pay dearly for it.
The takeaway for investors is to avoid being a noise (and meme) trader. Don’t get caught up in following the herd over the investment cliff. Stop paying attention to prognostications in the financial and social media. Most of all, have a well-developed, written investment plan. Develop the discipline to stick to it, rebalancing when needed and harvesting losses as opportunities present themselves. In other words, act more like an institutional owner and less like an amateur message board poster.
Larry Swedroe has authored or co-authored 18 books on investing. His latest is Your Essential Guide to Sustainable Investing. All opinions expressed are solely his opinions and do not reflect the opinions of Buckingham Strategic Wealth or its affiliates. This information is provided for general information purposes only and should not be construed as financial, tax or legal advice.


