
(Bloomberg Opinion) -- Investor worries about market concentration aren’t going away, and it’s easy to understand why: the so-called Magnificent Seven mega-cap growth stocks now constitute about 29% of the S&P 500 Index by market weighting, eliciting ominous comparisons to the peak of the dot-com bubble. Index investors simply have too many eggs in too few baskets, the thinking goes. And they’re pricy baskets, to boot!
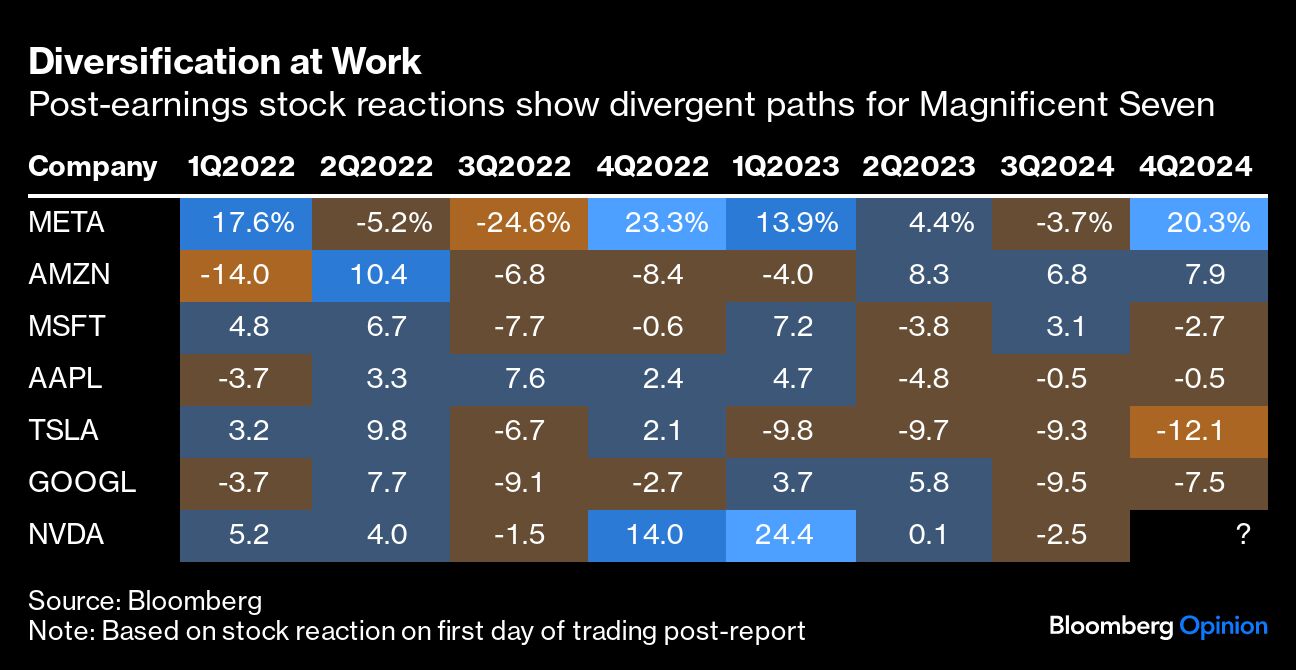
The latest round of earnings may allay some of those concerns. Not only have the Magnificent Seven performed reasonably well on the whole, but they’ve done so while performing differently from one another. That’s the power of diversification at work! Here’s how their stocks reacted to earnings announcements in recent weeks:
- Meta Platforms Inc.: +20.3%
- Amazon.com Inc.: +7.9%
- Apple Inc.: -0.5%.
- Microsoft Corp.: -2.7%.
- Alphabet Inc.: -7.5%.
- Tesla Inc.: -12.1%
- Nvidia Corp.: ?
This type of earnings season is more typical than not. As the chart below shows, the Magnificent Seven tend to take turns at exceeding investor expectations, a demonstration of how different their businesses are with revenue streams spanning advertising, cloud computing, e-commerce, hardware, cars and semiconductors, among other things. Clearly, they’d all be systemically vulnerable to, say, a crippling recession or a surge in government borrowing costs (more on yields later), but those aren’t most people’s base-case scenarios.
As extreme as the current concentration may be, the US stock market has always been somewhat top-heavy. At the start of the 20th century, the market was basically dominated by railroad stocks; in the early 1980s, energy companies held outsize sway; and at the turn of the millennium, the market was largely dominated by Internet and computing-adjacent firms. Market dominance is a constant feature of the American system, as is turnover in the firms and sectors at the top. Some day, a new crop of leaders will replace many of the Magnificent Seven, but I’m skeptical about anyone’s ability to call the turn. Meanwhile, I take a degree of comfort from a few places.
First, there’s real growth behind the companies’ booming market capitalizations. According to Goldman Sachs Group Inc. estimates, the Magnificent Seven increased sales by 14% in the fourth quarter to $523 billion amid expanding profit margins, while the rest of the index saw just 2% growth and contracting margins. The stocks trade at much richer valuations than their S&P 500 peers, but they’re not necessarily getting very pricy relative to their own trading histories. Here’s how Goldman researchers, led by Chief US Equity Strategist David Kostin, put it in a note Friday (emphasis mine):
Improving fundamentals, rather than valuation expansion, have driven the bulk of the group’s performance since 2019... Since December 2019, the Magnificent Seven stocks collectively delivered a 28% annualized return. Approximately 27 [percentage points] of the annualized return is attributable to earnings growth (21 pp sales growth and 6 pp margin expansion) with only 1 [percentage point] due to multiple expansion. In contrast, earnings drove only 13 [percentage points] of the S&P 500’s 17% annualized return since 2019.
According to Kostin, the seven companies are expected to expand sales at a 12% compound annual growth rate over the next three years, versus 3% for the rest of the index, and profit margins are expected to expand by 256 basis points (versus 44 basis points for all other stocks.) To further put the outperformance into context: it’s coming at a time when only about 57% of S&P 500 companies that have reported to date are growing their earnings at all, according to Bloomberg data.
While price-earnings multiples for the Magnificent Seven do draw some parallels to the dot-com-era behemoths, Kostin notes that today’s multiples come in an environment of relatively lower bond yields: the 10-year Treasury note yields about 4.16%, compared with an average of 6.32% in the first half of 2000. Certainly, the sustainability of those valuations depends on the durability of the growth story, but recent experience suggests that the seven disparate narratives are unlikely to collapse all at once.
Meanwhile, there’s a lively debate underway about the path of bond yields, but no mainstream forecasters see them returning to levels seen in the early 2000s anytime soon — and if they did, few financial assets would be safe.
Second, market giants aren’t necessarily awful long-term investments on average — even if you buy them at the peak. Take for example the heavy hitters of the dot-com bubble. Clearly, firms including Microsoft (-61%), Cisco Systems Inc. (-88%), General Electric Co. (-57%) and Intel Corp. (-81%) performed very poorly during the initial bust. But in the long run, the “Magnificent Seven of March 2000” have hung around. Five are significant underperformers, of course, but Microsoft has done so well that it has carried the group. If you’d gone long a basket of the top seven stocks at the peak on March 23, 2000, you’d still have quadrupled your money. The S&P 500 quintupled in the period, but it’s not the worst outcome.
If you had a crystal ball, you would have sold the mega-cap giants in March 2000 and bought back Microsoft and the new crop of leaders at their lows. But most of us don’t have that level of foresight. In reality, the debate comes down to a more nuanced question about weightings: should long-run investors continue to dollar-cost-average into concentrated market-cap-weighted indexes, or instead explore equal-weighting?
It’s often suggested that market-cap-weighted indexes are like momentum strategies: ultimately, they end up overweighting companies that have recently performed well and underweighting those that have done less well. For those very reasons, recent history has favored market-cap weighting, but in the longer-run there have been periods when equal weighting has done better.
- In the 1990s: market-cap weighting won: +432% versus 224%.
- In the 2000s: equal-weighting won: +40% versus -9%.
- In the 2010s: market-cap weighting won by a hair: +256% versus +255%.
- In the 2020s: market-cap weighting is pulling ahead again: +64% versus +48%
In short, different time horizons produce different conclusions, and both indexes have delivered reasonably impressive long-run returns. So, if market concentration keeps you up — more than the fear of missing out on potentially juicy returns — then equal weighting may be a perfectly defensible remedy. But while history shows that empires rise and fall, there’s nothing obvious in the latest round of earnings that screams that this one is in its final days.
More From Bloomberg Opinion:
- Matt Levine's Money Stuff: Mark Zuckerberg Lives Dangerously
- Elon Just Lost His Cage Fight With Zuckerberg: John Authers
- 'Hot Sauce' ETFs Will Thrive Even Without Cramer: Jonathan Levin
Want more Bloomberg Opinion? OPIN
To contact the author of this story:
Jonathan Levin at [email protected]


