
As Sam Adams and I explained in Your Essential Guide to Sustainable Investing, while the subject continues to grow in popularity, economic theory suggests that if a large enough proportion of investors choose to favor companies with high sustainability ratings (green businesses) and avoid those with low sustainability ratings (brown or sin businesses), the favored companies’ share prices will be elevated and the excluded shares will be depressed. In equilibrium, the screening out of certain assets based on investors’ preferences/tastes should lead to a return premium on the screened assets.
The result is that the favored companies will have a lower cost of capital because they will trade at a higher price-to-earnings (P/E) ratio. The flip side of a lower cost of capital is a lower expected return to shareholders. Sin companies, on the other hand, will have a higher cost of capital because they will trade at lower P/E ratios, the flip side of which is a higher expected return to shareholders. The hypothesis is that the higher expected returns reflect a premium above the market’s required return as compensation for the emotional cost of exposure to offensive companies. Conversely, investors in companies with higher sustainability ratings are willing to accept lower returns as the cost of expressing their values.
There is also a risk-based hypothesis for the sin premium. Companies neglecting to manage their environmental, social and governance (ESG) exposures could be subject to greater risk than their more ESG-focused counterparts. The argument is that companies with high sustainability scores have better risk management and better compliance standards. The stronger controls lead to fewer extreme events, such as environmental disasters, fraud, corruption and litigation. The result is a reduction in tail risk in high-scoring firms relative to the lowest-scoring firms. The greater tail risk creates the sin premium.
The book presented the empirical evidence supporting the existence of a sin premium—green stocks have lower expected returns compared to brown stocks. To this point, the literature has focused on measures related to the brown activities of firms, such as carbon emissions and industrial pollutants. New research has taken a different approach, focusing on firms’ efforts to develop green technology.
Is there a Green Innovation Premium?
Markus Leippold and Tingyu Yu, authors of the March 2023 study The Green Innovation Premium: Evidence from U.S. Patents and the Stock Market, investigated if firms’ green innovation efforts are reflected in their stock market prices—what is the empirical relation between green innovation activities and cross-sectional stock returns? They measured a firm’s greenness as the proportion of green patents in all patents, using data from the United States Patent and Trademark Office (USPTO) database. Their patent data covered the period 2006-2021. The authors explained: “Considering the intensive capital investment and lengthy development of patents, the share of green patents can be a good proxy for a firm’s commitment to transition to a low-carbon economy.” Their stock returns data covered the period July 2007-December 2021. Here is a summary of their key findings:
Firms with a higher proportion of green patents experienced lower stock returns than those with a lower percentage. The returns decreased from 1.16% to 0.54% from low to high greenness portfolios, generating a return spread of 0.62% with a t-statistic of 3.41 for equal-weighted portfolios. The return spread was even larger for the value-weighted portfolio (0.67% with a t-statistic of 2, economically and statistically significant).
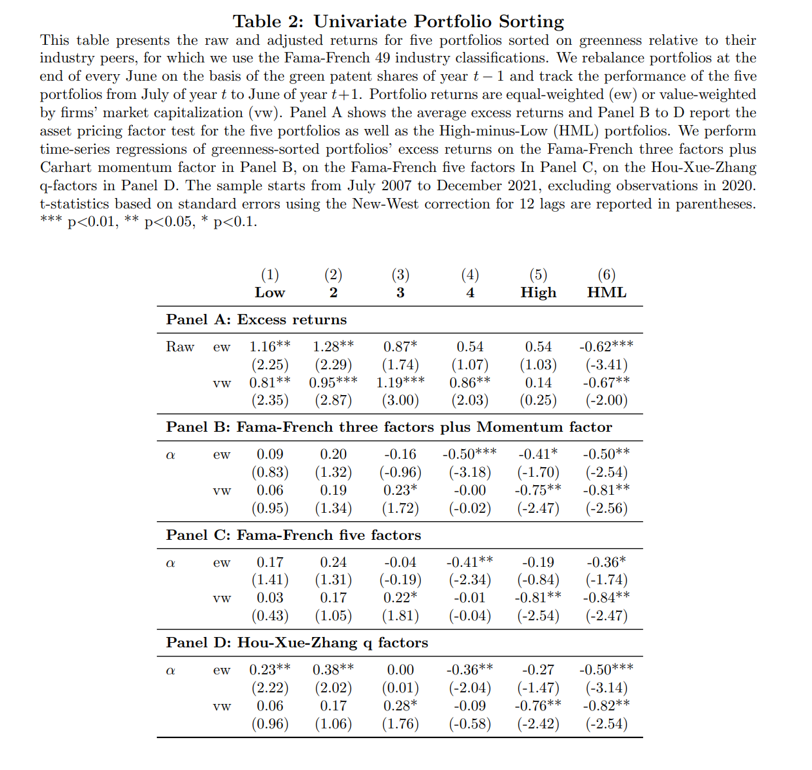
Returns remained significant when controlling for common risk factors: size, book-to-market, profitability, investment rate and carbon emission intensity.
The pricing effects mainly originated from energy and environmental management-based patents, including clean energy, electrical power efficiency and air pollution abatement technology. By contrast, green patents in production, transportation, buildings and adaptation did not gain enough attention from investors and were not priced. Firms with high green patent shares outperformed their counterparts after events that increased climate concerns and strengthened environmental regulations. Additionally, firms with green innovation attracted more institutional ownership, decreased their carbon intensity and were involved in fewer negative climate incidents in the first place.
Leippold and Yu’s findings led them to conclude: “A portfolio that is long (short) on firms with low (high) green patent shares earns an average excess return of about 8% per annum, which cannot be explained by common risk factors. Fama-MacBeth cross-sectional regressions that control for other firm characteristics confirm this significant negative association, suggesting that investors require lower returns for firms with advanced green innovation efforts.”
Investor Takeaways
Leippold and Yu’s findings are consistent with risk-based explanations: Green firms are less risky, as their technology investments make them more adaptable to the low-carbon economy and/or severe weather conditions. Moreover, their advanced development of green innovation can give them product differentiation and lower competition. Overall, they can better hedge against adverse climate shocks and thus enjoy a lower cost of capital. Green firms’ low cost of capital may also result from institutional investors’ preference (a behavioral explanation) for greenness that tilts their portfolios toward green assets—especially mutual funds motivated by social returns. Their lower cost of capital translates into lower expected returns.
Larry Swedroe has authored or co-authored 18 books on investing. His latest is Your Essential Guide to Sustainable Investing. All opinions expressed are solely his opinions and do not reflect the opinions of Buckingham Strategic Wealth or its affiliates. This information is provided for general information purposes only and should not be construed as financial, tax or legal advice.


