
In the first article in this series, I established that portfolios should be highly diversified based on risk and that traditional 60% stock/40% bond portfolios fall short because they’re dominated by a single risk: the market. I then discussed one method of diversification, the 1/N strategy, why it’s effective and how advisors can easily help their clients implement a 1/N-like portfolio. In this installment, we’ll take a look at incorporating alternative investments.
In addition to adding factor risks across asset classes through the largest long-short multifactor, multiasset class fund of AQR, the SEC’s approval of interval funds (funds that provide limited quarterly liquidity, typically a minimum of 5% per quarter and 20% per year), allows investors to access other unique sources of risk (with historically very low correlations to stocks and bonds) that were previously only available in private (and more expensive) vehicles such as hedge funds.
Among these unique sources of risk are reinsurance, consumer and small business lending and private credit to middle-market firms (which is also floating rate debt, minimizing interest rate/inflation risk). The largest reinsurance interval fund is Stone Ridge’s SRRIX; the largest consumer/small business lending fund is Stone Ridge’s LENDX, and the largest private credit interval fund is Cliffwater’s CCLFX. Again, because it is important to show the implementation costs of any investment strategy, our starting point is June 2019, the inception date of CCLFX, and runs through year-end 2022, a total of 43 months. We will show how adding these funds to a traditional 60/40 portfolio impacts its risk and return. While the period is relatively short, it does include bull and bear markets for both stocks and bonds.
The following table shows how a 15% allocation to four strategies (QSPRX, SRRIX, LENDX and CCLFX) using the 1/N equal-weighted approach impacts the risk (volatility and drawdowns) and returns of a traditional 60/40 portfolio using Vanguard’s low-cost index funds. It shows the results from taking the allocation to the alternatives from the equity allocation (investors more concerned with downside risk should prefer this approach) and from the bond allocation (investors willing to accept more risk should prefer this approach). Note that the 15% is just a hypothetical example. Sophisticated institutional investors with limited needs for liquidity have much higher allocations, so the table below also includes the results for a 30% allocation to the four alternatives.
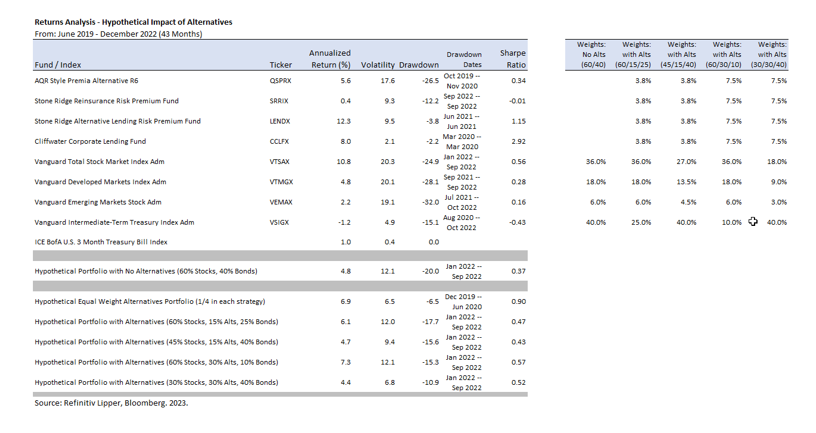
The table demonstrates the diversification benefits of adding alternatives regardless of whether the allocation was taken from higher-returning stocks to safer, lower-returning bonds:
- Taking a 15% allocation to the four alternatives from stocks improved the Sharpe ratio from 0.37 to 0.43 and reduced the largest drawdown from 20.0% to 15.6%. While returns were lowered from 4.8% to 4.7% (a relative reduction of 2%), volatility fell from 12.1% to 9.4% (a relative reduction of 22%).
- Taking a 15% allocation to the four alternatives from bonds improved the Sharpe ratio from 0.37 to 0.47 and reduced the largest drawdown from 20.0% to 17.7%. The portfolio returned increased from 4.8% to 6.1% (a relative increase of 27%), while volatility fell slightly from 12.1% to 12.0% (a relative decrease of 0.8%).
- Taking a 30% allocation to the four alternatives from stocks improved the Sharpe ratio from 0.37 to 0.52 and dramatically reduced the largest drawdown, cutting it almost in half, from 20% to 10.9%. While returns fell from 4.8% to 4.4% (a relative reduction of 8.3%), volatility fell from 12.1% to 6.8% (a relative reduction of 43.8%).
- Taking a 30% allocation to the four alternatives from bonds improved the Sharpe ratio from 0.37 to 0.57 and reduced the largest drawdown from 20.0% to 15.3%. Returns increased from 4.8% to 7.3% (a relative increase of 52.1%), and volatility remained unchanged at 12.1%.
Note also that the improvements occurred despite the significantly higher expense ratios of the alternatives (QSPRX 1.4%, LENDX 1.98%, SRRIX 2.29%, and CCLFX 1.64%) compared to those of the Vanguard index funds (VTSAX 0.04%, VTMGX 0.07%, VEMAX 0.14%, and VSIGX 0.07%)— while costs matter and should be a consideration when building portfolios, it is value added relative to the cost that should determine one’s decision.
A Longer Look
To allow us to examine the performance of strategies that add the alternatives over a longer time frame, the 79-month period from June 2016-December 2022, we will drop the inclusion of the newest interval fund, CCLFX, and limit the alternatives to an equal-weighted allocation to QSPRX, SRRIX and LENDX (June 2016 inception date).
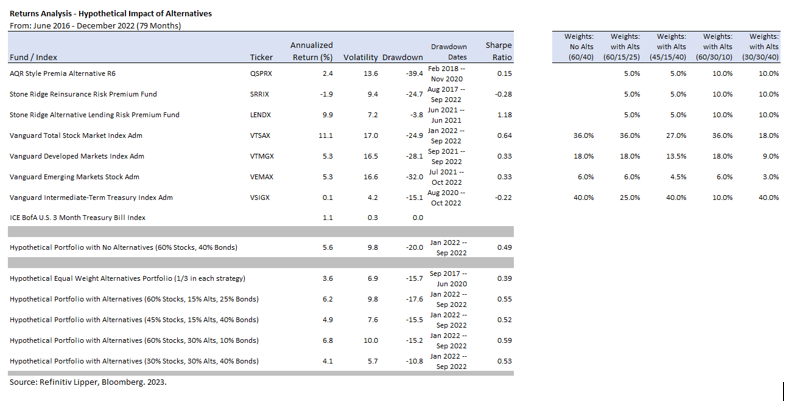
The table shows:
- Taking a 15% allocation to the three alternatives from stocks improved the Sharpe ratio from 0.49 to 0.52 and reduced the largest drawdown from 20.0% to 15.5%.
- Taking a 15% allocation to the four alternatives from bonds improved the Sharpe ratio from 0.49 to 0.55 and reduced the largest drawdown from 20.0% to 17.6%.
- Taking a 30% allocation to the four alternatives from stocks improved the Sharpe ratio from 0.49 to 0.53 and reduced the largest drawdown from 20% to 10.8%.
- Taking a 30% allocation to the four alternatives from bonds improved the Sharpe ratio from 0.49 to 0.59 and reduced the largest drawdown from 20.0% to 15.2%.
Note that the improved Sharpe ratio of the portfolio that included the three alternatives occurred despite it being below that of the 60/40 traditional portfolio (0.39 vs. 0.49). That demonstrates the importance of seeing things as a whole—evaluate the benefits of including a risk asset in a portfolio based not on its individual risks and expected returns, but on how the addition of that asset (or assets) impacts the risk and expected returns of the entire portfolio. Once again we see that while expense ratios are important, they should not be the only consideration when building a portfolio.
Portfolio Construction
The two above examples—adding exposure to other equity factors and adding exposure to various alternatives, are not mutually exclusive. Because all risk assets should have similar risk-adjusted returns, investors should consider adding exposure to as many unique sources of risk as they can identify that meet all the established investment criteria. Combining both strategies is superior to using just one.
In addition to combining strategies, several new alternatives recently have become available in interval fund form:
- Cliffwater’s Enhanced Lending Fund (CELFX): While CCLFX invests in senior, secured, sponsored (by private equity) loans, CELFX provides exposure to other forms of corporate debt, building a broadly diversified portfolio, including asset-based lending, structured mezzanine debt, specialty lending, secondaries, venture debt, real estate, rediscount lending, litigation finance, equipment leasing and royalties.
- Variant’s Alternative Income Fund (NICHX): Invests in a broadly diversified portfolio of loans, including specialty finance (senior credit facilities provided to other lenders and originators of risk assets secured by diversified pools of their origination), litigation finance, real estate debt and equity, trade finance, transportation finance and secondaries.
- Flat Rock’s Enhanced Income Fund (FRBBX): Invests in middle-market (rated BB) CLO notes.
- Flat Rock’s Opportunity Fund (FROPX): Invests in CLO equity.
- Apollo’s Diversified Real Estate Fund (GIREX): Invests in both private and public real estate.
Investor Takeaways
The main objective is to seek exposure to different betas. Because markets are highly efficient and all risk assets should have similar risk-adjusted returns, investors should “hyperdiversify” portfolios, adding as many unique sources of risk that meet all the required criteria. Doing so historically has created more efficient portfolios, with reduced volatility and a narrower dispersion of potential returns that reduced tail risk (thereby reducing the sequence risk of investors in the withdrawal phase of their investment life cycle).
Critics of factor-based strategies and alternatives often cite the psychological risk of tracking variance regret that comes from adding assets that will experience periods of underperformance relative to popular benchmarks such as the S&P 500 Index. That underperformance can lead to panic selling, which is certainly a risk for investors who don’t have the discipline to ignore it. However, as we discussed, logic and the empirical evidence demonstrate that adding alternatives is likely to lead to superior outcomes, reducing financial risks. Because you will have to live with one of the risks, the question for investors is: Which risk would you prefer to bear? The risk of tracking variance regret (by adding alternative sources of risk) or the reduced likelihood of achieving your goals?
While there is no right answer, putting the odds in your favor by “hyperdiversifying” is the economically logical decision if you can avoid tracking variance regret. One last point. The examples demonstrated that taking the allocation to alternatives from equities resulted in a significant reduction in both volatility and maximum drawdown. That result can certainly help some investors avoid panic selling.
Larry Swedroe has authored or co-authored 18 books on investing. His latest is Your Essential Guide to Sustainable Investing. All opinions expressed are solely his opinions and do not reflect the opinions of Buckingham Strategic Wealth or its affiliates. This information is provided for general information purposes only and should not be construed as financial, tax or legal advice. LSR-23-459
Performance is historical and does not guarantee future results. The performance presented above does not reflect the expenses associated with the management of an actual portfolio. Information may be based on third party data which may become outdated or otherwise superseded without notice. Third party information is deemed to be reliable, but its accuracy and completeness cannot be guaranteed. The availability of data dictates the time frames utilized in the tables above.


