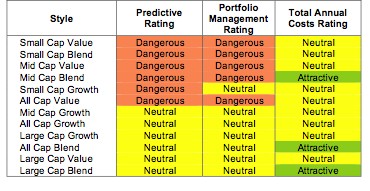
None of the fund styles earn a rating better than Neutral. See Figure 1 for my rankings on all twelve investment styles. My style ratings are based on the aggregation of my fund ratings for every ETF and mutual fund in each style.
Investors looking for style funds that hold quality stocks should look no further than the Large Cap Blend style. It is the only style with Attractive-or-better rated funds. Figures 6 and 7 provide details. The primary driver behind an Attractive fund rating is good portfolio management, or good stock picking, with low total annual costs.
Note that the Attractive-or-better Predictive ratings do not always correlate with Attractive-or-better total annual costs. This fact underscores that (1) low fees can dupe investors and (2) investors should invest only in funds with good stocks and low fees.
See Figures 4 through 13 for a detailed breakdown of ratings distributions by investment style. See myfree ETF & mutual fund screener for rankings, ratings and free reports on 7000+ mutual funds and 400+ ETFs. My fund rating methodology is detailed here.
All of my reports on the best & worst ETFs and mutual funds in every sector and investment style are available here.
Figure 1: Ratings For All Investment Styles
 Source: New Constructs, LLC and company filings
To earn an Attractive-or-better Predictive Rating, an ETF or mutual fund must have high-quality holdings and low costs. Only 25 style ETFs and mutual funds meet these requirements, which is only 3% of all style ETFs and mutual funds.
GMO Trust: GMO Quality Fund (GQLOX) is my top Large Cap Blend mutual fund. It gets my Very Attractive rating by allocating over 53% of its value to Attractive-or-better-rated stocks.
Johnson & Johnson (JNJ) is one of my favorite stocks held by GQLOX and earns my Very Attractive rating. JNJ has grown after-tax cash flow (NOPAT) by 11% compounded annually for the past 13 years. Its return on invested capital (ROIC) of 17% puts it in the top quintile of stocks we cover. Despite these strong trends, the market is seriously undervaluing JNJ. A share price of ~$74 puts JNJ’s price to economic book value ratio at only 0.8, which implies a permanent decline of 20% in JNJ’s NOPAT. Such low expectations seem overly negative for a company with a proven track record of growth.
Touchstone Strategic Trust: Touchstone Micro Cap Value Fund (MXCAX) is my worst Small Cap Value mutual fund. It gets my Very Dangerous rating by allocating over 72% of its value to Neutral-or-worse-rated stocks, and to make matters worse, charges investors annual costs of 4.48%.
OfficeMax Inc. (OMX) is one of my least favorite stocks held by MXCAX and earns my Dangerous rating. OfficeMax has seen its NOPAT decline by nearly 50% since 2006, including a 10% decline last year. The company would need to nearly triple its ROIC of 3% before it covers its cost of capital (WACC). OMX’s current share price of ~$10.50 implies 1o% growth in NOPAT compounded annually for eight years. Betting on such a dramatic turnaround seems too risky.
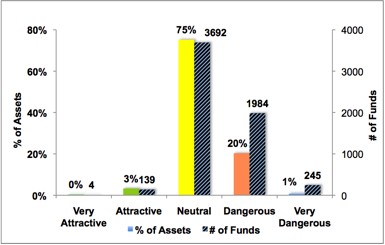
Figure 2 shows the distribution of our Predictive Ratings for all investment style ETFs and mutual funds.
Figure 2: Distribution of ETFs & Mutual Funds (Assets and Count) by Predictive Rating
 Source: New Constructs, LLC and company filings
Figure 3 offers additional details on the quality of the investment style funds. Note that the average Total Annual Cost of Very Dangerous funds is more than five times that of Very Attractive funds.
Figure 3: Predictive Rating Distribution Stats
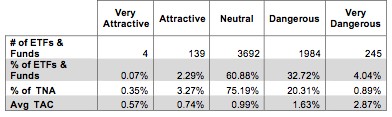 * Avg TAC = Weighted Average Total Annual Costs
Source: New Constructs, LLC and company filings
This table shows that only the best of the best funds get our Very Attractive Rating: they must hold good stocks AND have low costs. Investors deserve to have the best of both and we are here to give it to them.
Ratings by Investment Style
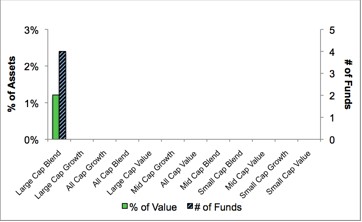
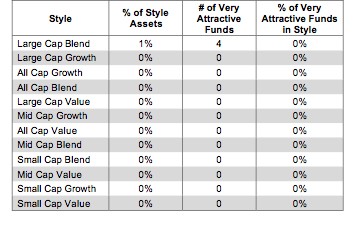
Figure 4 presents a mapping of Very Attractive funds by investment style. The chart shows the number of Very Attractive funds in each investment style and the percentage of assets in each style allocated to funds that are rated Very Attractive.
Only 4 investment style funds earn our Very Attractive rating, all in the Large Cap Blend style.
Figure 4: Very Attractive ETFs & Mutual Funds by Investment Style
 Source: New Constructs, LLC and company filings
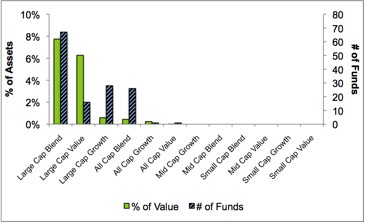
Figure 5 presents the data charted in Figure 4
Figure 5: Very Attractive ETFs & Mutual Funds by Investment Style
 Source: New Constructs, LLC and company filings
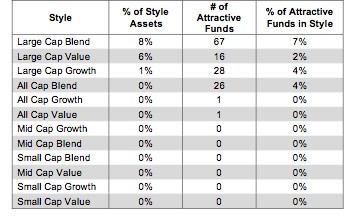
Figure 6 presents a mapping of Attractive funds by investment style. The chart shows the number of Attractive funds in each style and the percentage of assets allocated to Attractive-rated funds in each style. Even in the top-rated Large Cap Blend style, less than 8% of assets are allocated to Attractive-rated funds. Right now, investors are not getting their money’s worth from ETFs and mutual funds.
Figure 6: Attractive ETFs & Mutual Funds by Investment Style
 Source: New Constructs, LLC and company filings
Figure 7 presents the data charted in Figure 6.
Figure 7: Attractive ETFs & Mutual Funds by Investment Style
 Source: New Constructs, LLC and company filings
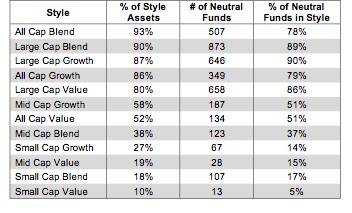
Figure 8 presents a mapping of Neutral funds by investment style. The chart shows the number of Neutral funds in each investment style and the percentage of assets allocated to Neutral-rated funds in each style.
Figure 8: Neutral ETFs & Mutual Funds by Investment Style
 Source: New Constructs, LLC and company filings
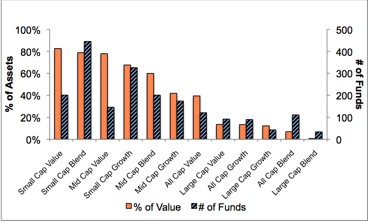
Figure 9 presents the data charted in Figure 8.
Figure 9: Neutral ETFs & Mutual Funds by Investment Style
 Source: New Constructs, LLC and company filings
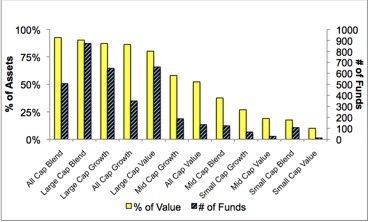
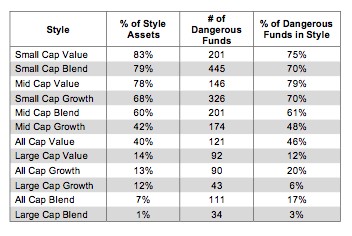
Figure 10 presents a mapping of Dangerous funds by fund style. The chart shows the number of Dangerous funds in each investment style and the percentage of assets allocated to Dangerous-rated funds in each style.
Over 80% of assets are allocated to Dangerous-rated funds in the Small Cap Value style, a clear sign that investors are struggling to recognize the best funds. As detailed in low cost funds dupe investors, investors are great at recognizing cheap funds but have issues identifying those with the best assets. Ourpredictive rating methodology analyzes the holdings of funds to help investors find the best funds.
Figure 10: Dangerou ETFs & Mutual Funds by Investment Style
 Source: New Constructs, LLC and company filings
Figure 11 presents the data charted in Figure 10.
Figure 11: Dangerous ETFs & Mutual Funds by Investment Style
 Source: New Constructs, LLC and company filings
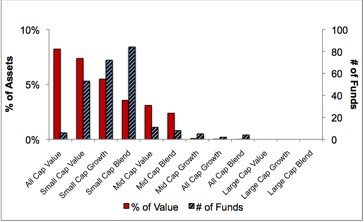
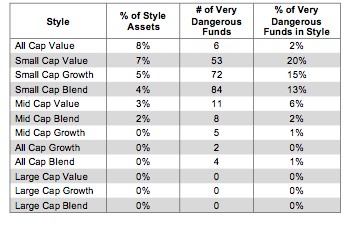
Figure 12 presents a mapping of Very Dangerous funds by fund style. The chart shows the number of Very Dangerous funds in each investment style and the percentage of assets in each style allocated to funds that are rated Very Dangerous.
Figure 12: Very Dangerous ETFs & Mutual Funds by Investment Style
 Source: New Constructs, LLC and company filings
Figure 13 presents the data charted in Figure 12.
Figure 13: Very Dangerous ETFs & Mutual Funds by Investment Style
 Source: New Constructs, LLC and company filings
Sam McBride contributed to this report.
Disclosure: David Trainer owns JNJ. David Trainer and Sam McBride receive no compensation to write about any specific stock, sector or theme.