
Warren Buffet once said the best way to make money is to make sure you don’t lose it.
We couldn’t agree more. That’s why we’re moving our clients to cash.
In early February, our Market Sentiment Indicator (MSI) crossed over from bullish to bearish on equities. After 58 weeks of being bullish, our indicator finally turned negative on the heels of global economic uncertainty.
As a result, we’ve shifted into 100% cash position. This shift to cash allows us to focus on capital preservation, as is always prudent in bearish cycles.
The Case For Bear Territory
In making this decision, we looked at the market’s performance from a long-term historical perspective.
On average, bullish cycles last 22 weeks. The longest on record clocked in at 73 weeks (October 29, 1992 to March 3, 1994). However, as we now know, the ‘80s and '90s were quite different than today. Back then, we were in the midst of a long-term bullish expansion that lasted 17 years. That bull market was driven by new technology that was reshaping our daily lives.
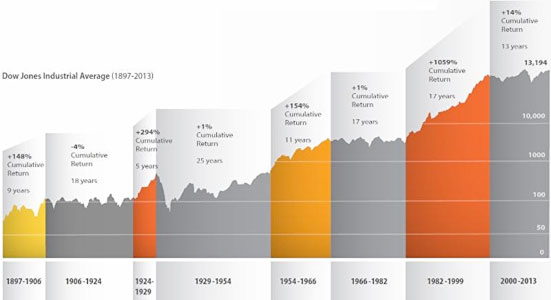
*Data collected from Dow Jones. Logartithmic graph of the Dow Jones Industrial Average from January, 1897 through December, 2012. Performance displayed represents past performance, which is no guarantee of future results.
The chart of the Dow Jones Industrial Average (above) shows where we are in the longer-term market cycles. To understand the future, we analyzed what happened in the past in similar market conditions. We’re particularly focused on time periods when the market was positive for five consecutive years.
Since 1927, this has happened only seven times. The stretch between 1982 and 1986 was the first time such a streak occurred. We just finished the most recent period from 2009 to 2013.
So, are we really at the beginning of a new bull market? Or are we due for a correction that puts the market back to its trendline as seen above in the most recent gray portion?
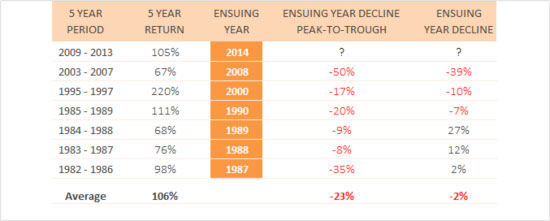
*Data collected through FactSet
After looking at the above data, it's clear that the year after any five consecutive years of positive returns delivers some large volatility and rather undesirable investment returns. 2014 appears to be the year after one of those five-year run-ups.
How Long Will It Last?
On average, a bearish cycle lasts 14 weeks. The longest lasted 41 weeks from June 18, 2008 to April 8, 2009. If you refer back to the table, you can see that 2008 was the year after five positive years. It’s a year many investors will never forget.
Successful investing is as much about asset appreciation as it is knowing when to stay out of the market. We're not predicting what 2014 will do. Rather, we’re pointing to what history has shown us in these similar scenarios.
Kyle Shealer is Co-founder and Partner of Crosspoint Capital Management, an asset management firm serving individuals, RIAs and institutions.


