
For many years closed-end fund (CEF) investors have looked at return of capital (RoC) in CEFs either as negative, because it can be thought of as eroding the fund’s net asset value (NAV), or as positive because it can be used for tax-deferred income generation. This tax deferral occurs because the portion of a CEF’s distribution that is RoC, reduces its cost basis and is only realized for tax purposes, when the fund is sold by the investor. Over the years, Closed-End Fund Advisors (CEFA), has worked hard to better understand this data point and how it can be used for CEF research and analysis.
Here we will explain how we determine when a fund is currently showing Destructive vs. Constructive RoC, the newest data point in our weekly CEF data service. In simple terms, Constructive RoC is due to accounting definitions and/or is deemed repeatable. Repeatable means that the portfolio manager has actually grown the CEF’s NAV on pace with the distribution policy. Destructive RoC is used to describe a CEF that is eroding its principal or NAV. We believe that a fund’s continual use of Destructive RoC will lead to a smaller asset base and the board of directors will be forced to reduce the distribution policy at some point in the future to better align the policy with the fund’s actual earnings and growth potential.
Background:
For those not already familiar with the concept of Return of Capital (RoC). A CEF’s distribution can be classified in one of four ways: 1. Income 2. Short-Term Capital Gains 3. Long-Term Capital Gains 4. Return of Capital. During the year, CEFs estimate these classification through Section 19 notices. At year-end, they give investors the final classification in order to file their tax return correctly with the Internal Revenue Service (IRS).
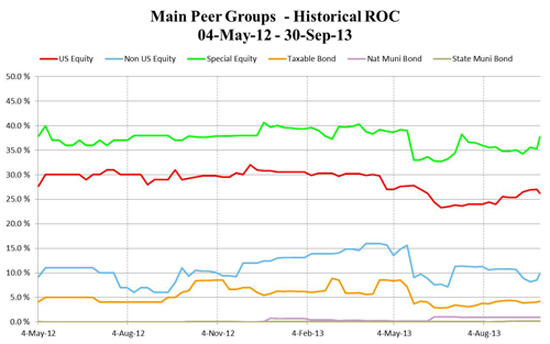
As of September 27, 2013 there are 601 CEFs as tracked in our weekly CEF Universe Data Service. 129 of these CEFs have reported RoC in the past 90 days and 183 in the past 12 months. Over the past 12 months, 59 of these are bond CEFs and 124 are equity CEFs. There were 7 Municipal Bond CEFs and 52 Taxable Bond CEFs with RoC classifications. Currently the average RoC classification for a bond CEF is 15.08% and 54.24% for the average equity CEF. Two points can be made from this data: 1. RoC is more of an Equity CEF issue, and 2. It is unusual for a Bond CEF, especially a Municipal Bond CEF, to show RoC. Investors should understand this if they find RoC in CEFs they own or are considering purchasing.
How CEFA Calculates Destructive RoC:
Step #1: First, we want to account for how a CEF’s distribution classification will change over time, while also recognizing that year-end RoC classifications are the only absolutely correct figures. CEFs estimate RoC during the year on a best efforts basis. As our data service tracks both 90 Day RoC and 12 Month RoC figures we decided to do a 2/3 weighting for 12 month RoC data and 1/3 weighting for 90 Day RoC Data for this analysis. This allows for some sensitivity for a CEF’s portfolio that is currently showing less RoC without losing the impact of final year-end calculations from the previous tax-year. Using this weighting we get our Adjusted RoC percentage.
Step #2: We compare a CEF’s NAV Yield vs. 1-year NAV total return performance (NAV TR). The reason we use NAV yield and NAV performance figures is because this is data that the portfolio manager and board have control over, and thus, can be judged against without the inefficient market movements often reflected in a CEF’s market price yield and market price total return. We believe if a CEF has a 1 year NAV TR that is above its NAV yield, then the distribution has been paid from NAV growth and thus is not destructive in nature. If a fund’s NAV TR performance does not meet its NAV yield then we look at what percentage of the NAV yield was covered by the NAV TR. Then, as most CEFs that report RoC are under 100% of their distribution, so we adjust for the percentage of the NAV TR loss that can appropriately be allocated to RoC vs. the other three distribution classifications that make up the NAV Yield. It is important to note that just because a fund has negative NAV TR doesn’t mean it necessarily has Destructive RoC. It will be prorated based on the RoC data and NAV TR vs. NAV Yield. This calculation gives us a Destructive RoC Component.
Step #3: Is RoC Normal for a Peer Group of CEFs? One of the primary ways we analyze a CEF at our firm is to look at what is normal for the peer-group of funds. When a fund is an outlier vs. peer-data we try to answer the question of Why? In order to allow for this concept to be applied, we use a factor to increase or decrease a fund’s Destructive RoC Component based on peer-group data. What is the average RoC figure for the typical fund in its peer group?
If the individual CEF’s RoC is more than 10% higher than the peer-average data, then we increase the percentage Destructive RoC by 7.5%. If it is more than 20% of the peer average, then we increase it by 15% and if it is more than 30% of the peer-fund’s average RoC, then we increase it by a factor of 25%. We also reward CEFs with percentages less than their peer-group average RoC data by reducing the amount of Destructive RoC by the same percentage terms for being 10%, 20% or 30% or more lower than peer-group average data.
Step #4: Do the math. In order to show the data in use with a small group of funds, we selected the US Equity Fund’s sub-group, General US Equity Funds. We would argue that this group of CEFs has little accounting or sector reasons to use RoC. If we screen for funds in this group with some RoC classified in the past year and $500K a day in average trading liquidity, we can compare the seven CEFs in the table below.
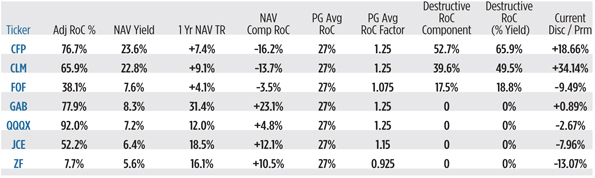
Conclusion: For those that are familiar with RoC in the Equity CEF sector, they should not be surprised with CFP’s and CLM’s Destructive RoC designation. CFP and CLM also trade at significant premiums to NAV which in our opinion, creates more downside risk as investors are seemingly buying yield that is not easily sustainable with these funds. FOF, which is the only CEF that is made up primarily of other CEFs, has a NAV yield close to the average CEF yield of 7.0%, however, still has a distribution level we believe is slightly too aggressive vs. its current performance characteristics. As FOF trades at a -9% discount to NAV the risk of significant market losses due to a distribution cut is reduced, However, the fund still has a strain on NAV if the portfolio cannot find a way to grow over time after expenses and its distribution policy.
As with all data calculations, Destructive RoC has its benefits, as it allow one to quickly review and compare funds, but it should not be used as the only indicator for if a fund should be consider a buy or a sell. Each investor has different risk and return goals and should consult with a qualified financial advisor to determine if a CEF meets their investment objective.
Disclosures: In Step #3, we decided to make the subjective decision to increase and decrease the destructive RoC by a factor determined relative to the CEF’s peer-group average data. This was intended to lessen the impact for funds with a reduction of RoC when it is more common for the sector, for example with MLP, Option Income and REIT funds.
The views and opinions herein are as of the date of publication and are subject to change at any time based upon market or other conditions. None of the information contained herein should be constructed as an offer to buy or sell securities or as recommendations. Performance results shown should, under no circumstances, be construed as an indication of future performance. Data, while obtained from sources we believe to be reliable, cannot be guaranteed. Data unless otherwise specified if from CEFA’s Closed-End Fund Universe Data dated September 27, 2013.


