
If retirement savings plan investment options were ice cream flavors, stable value funds would be a serious contender for the vanilla label.
From plan participants’ perspective, what matters is their SVF’s rate versus the plan’s available money market funds. Plan sponsors and advisors have a wider range of concerns with the funds, of course, but it’s likely that the defined contribution plan’s non-guaranteed investments receive greater scrutiny only because their returns are more volatile.
Nonetheless, there is over $733 billion in SVFs held in 167,000 DC employee benefit plans, according to the Stable Value Investment Association’s fourth-quarter 2017 survey. That amount accounts for about 10 percent of the $7.1 trillion that the Investment Company Institute estimates is in DC plans of all types.
Beneath the Surface
SVFs are complex and, from a fiduciary perspective, they require as much due diligence as other plan investments. For example, Minneapolis-based Hueler Analytics Inc.’s SVF database reports on: historical performance (individual returns and comparative returns versus the appropriate SVF- universe benchmark); underlying investment strategies (credit policy and quality, duration, diversification); and fund characteristics such as market value/book value ratios, size, participant demographics and fees.
Professional financial education programs don’t spend much time, if any, on SVFs, according to Kelli Hueler, founder of Hueler Analytics Inc. “Unfortunately, stable value has always had the short shrift,” she maintains. “It’s not covered in any of the curriculum that a CFP or CFA learns when they get their credentials. It’s often not covered in a traditional finance background within any of the big firms. So, advisors come to this required role of helping the fiduciary without nearly the depth of experience that they have in other asset classes.”
Analytic Software
A shortage of available SVF analytic tools adds to the challenge of working with the funds, Hueler maintains. She says that from the advisor’s perspective, there has been a lack of readily available and easy-to-use data sources versus what is available for other marketable securities. While Hueler Analytics has subscription plans to its SVF data, users, for example, wishing to download that data directly must have the ability within their organization to capture and process the data. “[Our] existing database is used to produce both hard copy reports and the data available for download for subscribers, but they must have their own tool to work with the data,” Hueler notes. “Most advisors aren’t comfortable creating their own tool.”
Hueler believes that her company’s new online software product, Hueler Analytics Stable Value Compass, which launched this past July, will improve advisors’ ability to access and work with SVFs. The goal is to combine the firm’s historical database with the firm’s experience, providing SVF analyses in an easy-to-use framework. Its design is intended to allow both experienced and new advisors to “have a high level of comfort with the framework that’s being presented so that they know when they go to do their work for their client, they’re fulfilling their duty as a fiduciary and providing the best possible analysis about evaluation and ongoing oversight,” she says.
Hueler and her associate, Kathleen Schillo, gave an online demonstration of the software. Some of the key features include:
- Coverage of both insurance company products and pooled funds.
- Access to historical fund data, depending on subscription plan.
- Data for the historical Hueler SV indexes and full data universes.
- Inclusion of base funds’ data and the various share classes in each base fund.
- Direct comparisons of funds’ characteristics versus universe averages such as duration, market value to book value ratio, credit quality, and size, with a grid summarizing the comparisons.
- Specific fund-to-benchmark comparisons: pooled funds versus pooled fund universe; insurance company-sponsored products versus that universe’s averages (see screen shot).
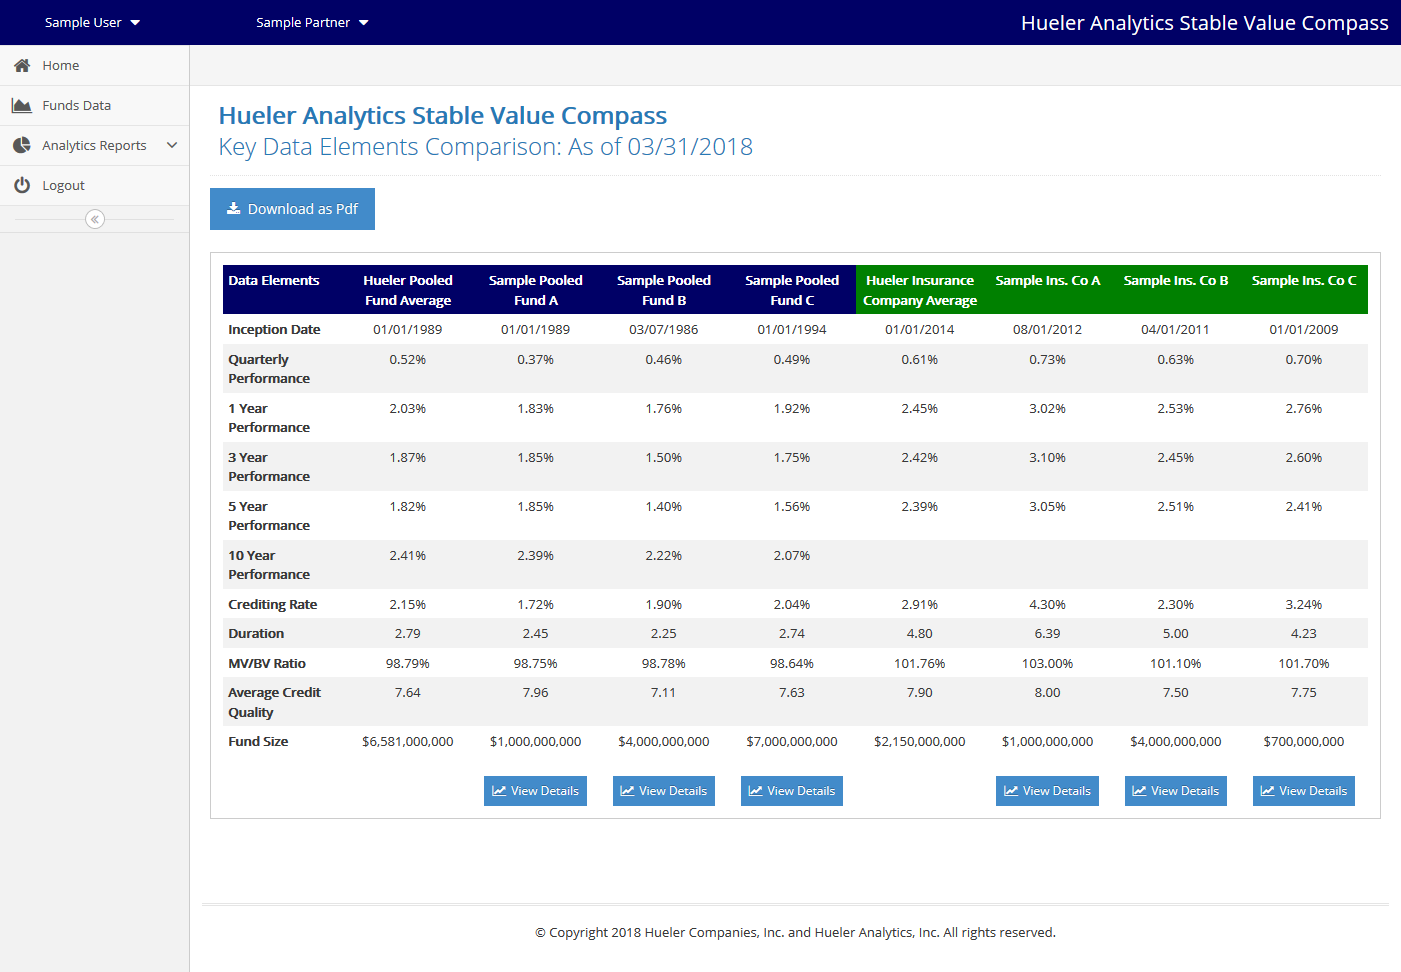
The screen’s layout shown here is representative of the other displays. Each screen contains a large amount of data and analytics, with some pages using graphics, but the presentations are clean and easy to understand. Most analytic programs overwhelm the viewer/reader with crammed displays and print layouts, but this program is making smart use of white space, and the reports can be shared in the default format with plan sponsors.
Hueler believes the framework can serve as a baseline fiduciary review that advisors can use continuously to evaluate the same key data elements with continuity from one plan evaluation to the next. Reports can be exported to PDF format for presentation and advisors who want to, and are able to, can customize their reports to have full access to all the data.
The software is subscription-based and the annual fee ranges from $2,500 to $15,000, depending on the number of end-users at the buyer’s location. Hueler hopes the software will improve advisor’s work with SVFs: “From our perspective it’s a great opportunity to elevate the level of service or assistance that an advisor can provide to a plan fiduciary.”


