
When investors speak of “the market,” they are commonly referring to the S&P 500 Index. Originally the index was created as a basket of 500 companies offering investors a way to gauge, in a diversified and broad manner, the strength of the U.S. economy. Additionally, the index offered investors the ability to compare their portfolio performance results versus the “average” company. With the advent of exchange traded funds (ETFs), particularly passive index ETFs, the S&P 500 Index has grown into the largest and most commonly used performance reference point, allowing investors to “own the market.” However, many investors are unaware that the S&P 500 Index is weighted by its market capitalization. This means the securities that have gone up in market value rise in weight in the index and thus become more influential in terms of the outcome of the overall performance of the index. No other valuation metric is used to determine a company’s weight in the index. When one position goes up relative to another, so too does its weight and impact.
Because the index is passive, there is no one making sure positions and sectors are being constrained, profits being taken, managed for tax efficiency, or is being mindful if market expectations become irrationally exuberant. This creates potential risks that many investors may not have considered when buying a passive index fund. In its current makeup, certain stocks and sectors within the S&P 500 have grown to very large weights. With the intention of “owning the market,” in its current construct, the S&P 500 is not really the clear representation of the market that investors may have expected.
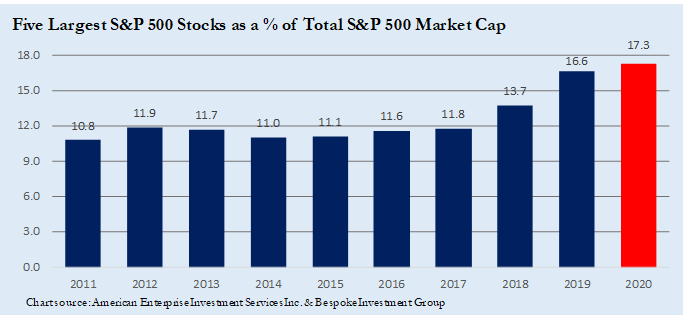
Position Concentration Risk
As of 12/31/19, the top five positions in the S&P 500 constitute 16.6% of the index and, midway through January, touched 17.3%. This is the largest concentration of the top five positions not seen since the eve of the dotcom bubble burst in 1999–2000. The S&P 500 is in the midst of its largest bull market ever! Ten years ago, this would be hard to fathom as the global economy was emerging from the Great Recession. However, it’s important to understand that, particularly from 12/31/16 to 12/31/19, the market has been driven higher by a handful of stocks. For example, the famous “FAANG + MSFT” stocks have contributed 27% of the total return of the market during this time. At year-end, Apple and Microsoft were 4.6% and 4.5% the weight of the S&P 500, respectively. This was a higher weighting than four entire sectors of the market: Energy, Utilities, Real Estate and Basic Materials. Said another way, the quarterly earnings results of Microsoft and Apple have become more important to the returns of the index than all the companies that make up each of those sectors.
Sector Concentration Risk
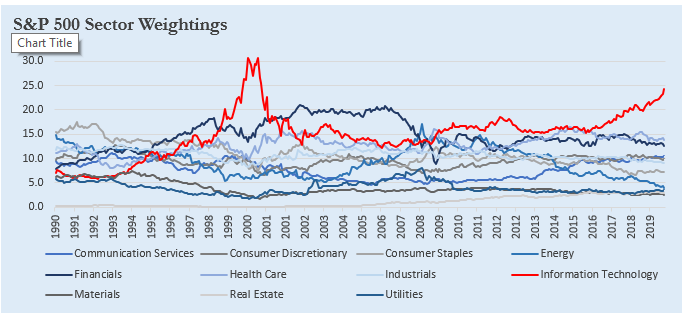
At the end of the year, the Technology and Communication Services sectors (which hold the likes of Alphabet and Facebook), combined were 33.6% of the S&P 500. If you add in Amazon, which is categorized as a Consumer Discretionary stock, the concentration is closer to 36%. Sector concentration is not unusual for the index, but we have seen this story play out before. In 1999 the Tech and Telecom sectors combined were near 40%; Financials in 2007 were at 22%; and Energy in 2008 was at 16%. Once these sectors reached these peaks, the following years were met with a precipitous sell-off: the blowup of the dotcom bubble in 2000, the collapse of Bear Stearns beginning in 2007, and the emergence of U.S. shale to squash the “peak oil” debate. The current sector concentration is not a forecast of impending doom but rather a wake-up call for investors to be aware of the potential risk being taken by simply “owning the market.”
Lack of International Exposure
The U.S. economy is 23% of global GDP or, said another way, 77% of the global economy is outside the U.S. With the rise of globalization and the advent of the World Trade Organization, since 2000 the world economy is more connected than ever before. Yet, there are no ADRs and/or non-U.S.-based companies allowed to be held in the S&P 500 Index. The only international exposure an investor in the S&P 500 gets is through each individual company’s geographical diversification. For example, Coca-Cola gets more than 50% of its sales from outside the U.S. This calls into question, given the global nature of the economy, if the S&P 500 is even the correct index to use when measuring investment performance or against the average company.
Avoid Predicting the Future by Extrapolating the Past
Given that the index is market-cap weighted, the future expectations of a positive outcome for the largest holdings could, in our view, already be baked into the stock prices. Odds are that the top 10 largest holdings of today might not be the largest 10 years from now. For example, in 1989 the largest companies in the world were Japanese. Since then, Japan’s economy has been stuck in the mud. In 1999, the largest companies were Tech and Telecom related to dotcom and the internet. It took 15 years post-bubble before the Nasdaq Index reached its pre-dotcom-bubble peak value. Finally, go back to the end of 2009; most of the top 10 companies were all based on the future of China and its ability to sustain 10% GDP growth. Investors were banking on continued strength from the BRIC countries (Brazil, Russia, India and China). Fast forward to today, and many investors question whether the Chinese economy can maintain 6% GDP growth. Lesson learned; when looking at index funds today, chances are the top 10 might not be so in 2029.
Don’t Forget Valuation
As the market value of a company goes up, so too does its valuation. Investors buying a passive index fund need to be mindful of what they are paying for. At current levels, the S&P 500 is trading at 18.1x Wall Street analyst earnings estimates. This is a 20% premium to where the index has traded over the past 10 years, and 15% over the past 20 years. Part of this is justified because interest rates are so low. If bonds are offering just 2%, and cash less than 1.5%, then investors are pushed out the risk curve into stocks because there are no alternatives. The economy is fairly healthy, inflation seems contained, and businesses are reinvesting cash and returning it to shareholders. So, despite normal day-to-day volatility, the backdrop for stocks to appreciate appears to be good. However, at current valuations, the margin of safety, or room for error, is slim. Shocks to the system will be met by a pullback in equity prices because valuation multiples are elevated.
Diversifying your assets is Investing 101. Spreading investments across various asset classes, stocks, regions, credit, investment type, is the one way investors can compensate for not having a crystal ball to predict the future. As an active manager, we have a fiduciary responsibility to diversify our clients’ assets in an appropriate way to meet a certain investment policy guideline. Investors have embraced index funds, particularly the S&P 500, to simply “own the market.” However, we believe, given elevated valuations, individual position and sector concentration, and lack of international exposure, buying the S&P 500 Index fund today is like buying a used car without opening up the hood and taking it for a ride. Do you really know what you are buying?
John Petrides is a portfolio manager at Tocqueville Asset Management.


