
As we expected, the economic data released over the past six weeks or so suggest that the U.S. economy has snapped back in the second quarter of 2014, after a run of unusually harsh winter weather in the eastern half of the country severely curtailed economic activity in the first quarter. Economic growth — as measured by real (inflation-adjusted) gross domestic product (GDP) — was reported at just +0.1% in the first quarter of 2014, but data released since then (for February and March 2014) suggest that first quarter GDP growth may be revised significantly lower when an updated first quarter GDP report is released at the end of May. In fact, the data now suggest that the U.S. economy likely contracted in the first quarter of 2014.
Recession Watch?
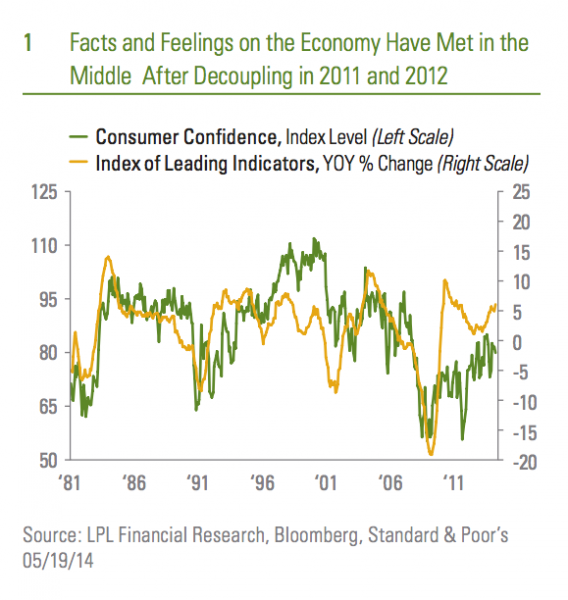
Could the first quarter GDP report be a harbinger of a recession? We do not think so, and our view remains that the economy will accelerate in 2014 (relative to 2013), and that GDP may increase 3.0% for the year.* In the May 12, 2014 Weekly Market Commentary: The Best Indicator May Be a Long Way From Signaling the Start of a Bear Market, we discussed the yield curve and its usefulness as an indicator in equity bear markets and recessions. The yield curve, defined as the difference in yield between the 10-year Treasury note and the three month T-bill, is one of the 10 components of the Index of Leading Economic Indicators (LEI). However, the Conference Board — the private sector think tank that compiles the LEI — uses the federal funds rate instead of the three month T-bill. (See the nearby box for all the components of the LEI.)
The April LEI is due out on Thursday, May 22, 2014. The consensus of economists as surveyed by Bloomberg News expects that the LEI may have increased by 0.4% between March and April 2014, another signal that the economy rebounded in the second quarter after the harsh winter constrained Q1 growth.
Have You Seen the LEI Lately?
If you have not seen the LEI lately, several components have been changed. However, as before, virtually all of the components of the LEI are known before the report is actually released, so in theory, the LEI itself should not be a surprise to market participants, the media, or pundits. Of course, that will not prevent anyone from ascribing movement in financial markets on Thursday, May 22 to the LEI data, even though the S&P 500 Index itself is a component in the LEI.
In December 2011, the Conference Board made three changes to the LEI:
- The Conference Board’s proprietary Leading Credit Index (LCI), an aggregate of several well-known financial market and credit market metrics like swap spreads, investor sentiment, margin accounts, etc., replaced the inflation-adjusted M2 money supply.
- The Institute for Supply Management’s (ISM) New Order Index replaced the ISM’s Supplier Delivery Index.
- The U.S. Department of Census’ new orders for nondefense capital goods excluding aircraft replaced new orders for nondefense capital goods.
Index of Leading Economic Indicators Place Very Low Odds of Recession in Next 12 Months
In the 12 months ending in March 2014, the LEI increased 6.1%. The LEI is designed to predict the future path of the economy, with a lead time of between six and 12 months. Since 1960 — 651 months, or 54 years and three months — the year-over-year increase in the LEI has been at least 6.1% in 191 months. Not surprisingly, the U.S. economy was not in recession in any of those 191 months. Thus, it is highly unlikely that the economy was in recession in March 2014, despite the likely below zero reading on real GDP in the first quarter of 2014.
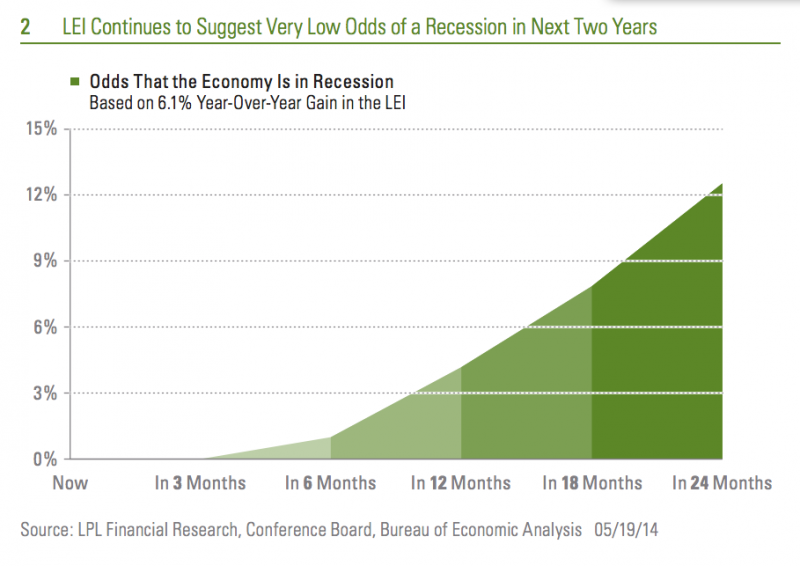
But the LEI is designed to tell market participants what will likely happen to the U.S. economy, not what has already happened. Over the last 60 years, the economy has been in recession 7 times for a total of 91 months, or 14% of the time, but at 6.1%, the year-over-year gain on the LEI through March 2014 suggests that the odds of recession in the next year are very very low. Three months after each of the 191 months that the LEI was up 6.1% or more, the economy has never been in recession. Six months after the LEI was up by 6.1% or more, the United States economy has been in recession in just two of the 191 months, or 1% of the time. Looking out 12 months after the LEI was up 6.1% or more, the economy was in recession in just eight of the 191 months, or 4% of the time. Looking out 18 – 24 months after the LEI is up 6.1% or more, the odds of a recession increase to between 5% and 15%.
On balance, the LEI report this month may say the risk of recession in the next 12 month is negligible at 4%, but not zero. We would agree. A dramatic deterioration of the fiscal and financial situation in Europe, a fiscal or monetary policy mistake in the United States or abroad, or an exogenous event (a major terror attack, natural disaster, etc.), among other events, may cause us to change our view that the odds of a recession in the United States remain low. But for now, based on the LEI, it looks like we are still in the middle of the economic cycle that began in June 2009.
IMPORTANT DISCLOSURES
The opinions voiced in this material are for general information only and are not intended to provide specific advice or recommendations for any individual. To determine which investment(s) may be appropriate for you, consult your financial advisor prior to investing. All performance reference is historical and is no guarantee of future results. All indices are unmanaged and cannot be invested into directly.
*As noted in our Outlook 2014: The Investor’s Almanac, our GDP forecast is based upon many of the drags of 2013 fading, including U.S. tax increases and spending cuts, the European recession, and accelerating growth from addition hiring and capital spending by businesses.
Index Descriptions
The Institute for Supply Management (ISM) index is based on surveys of more than 300 manufacturing firms by the Institute of Supply Management. The ISM Manufacturing Index monitors employment, production inventories, new orders, and supplier deliveries. A composite diffusion index is created that monitors conditions in national manufacturing based on the data from these surveys.
The Standard & Poor’s 500 Index is a capitalization-weighted index of 500 stocks designed to measure performance of the broad domestic economy through changes in the aggregate market value of 500 stocks representing all major industries.
This research material has been prepared by LPL Financial.
To the extent you are receiving investment advice from a separately registered independent investment advisor, please note that LPL Financial is not an affiliate of and makes no representation with respect to such entity.

