
At the beginning of the year, many investors believed analysts’ forecasts for a faster pace of earnings growth combined with lower valuations would lead to stocks in Europe and Japan outperforming U.S. stocks. Now those earnings forecasts are being cut sharply, raising the questions of how much of a value international developed market stocks are and whether they can outperform the U.S. market in 2014.
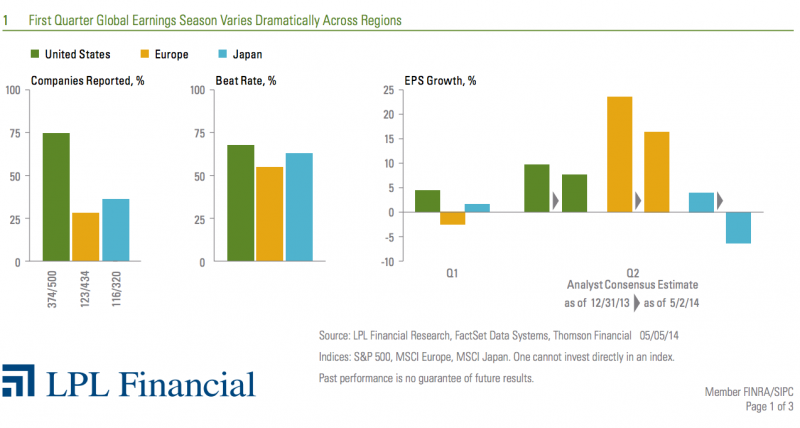
Four times a year investors focus on the most fundamental driver of investment performance: earnings. For U.S. stocks, the earnings reporting season has produced nearly all the gains in the stock market over the past four years with nothing but volatility, on average, during the other weeks of the quarter. The earnings season in the United States is now nearly over with 374 of the S&P 500 companies—representing 80% of the market value of the index—having reported. While the earnings season will only reach the halfway point this week in Europe and Japan, the difference so far between their earnings results and guidance and U.S. markets is striking. High hopes of an overseas earnings rebound are being disappointed, which may be creating a performance headwind.
There are three areas of key regional differences in the global first quarter earnings season: expectations, growth, and guidance [Figure 1].
· Expectations. The United States, Europe, and Japan have seen most companies exceed analyst estimates for the first quarter. The United States has the strongest first quarter beat rate at 68%. This is above the long-term average of 63% and the average over the past four quarters of 66%.
· Growth. Relative to Europe and Japan, the United States has the best first quarter earnings per share growth rate; although at only 4.5% it is a bit soft and must improve in coming quarters to lift stocks. We believe it may as the weather that had a dramatic effect on first quarter economic activity gives way to pent-up demand in the second quarter. The United States looks to continue to be on track for the 5-10% growth in earnings we forecast for the year in our Outlook 2014: The Investor’s Almanac, published in November 2013. However, the decline in European earnings from a year ago and paltry 1.6% growth in Japan raises serious doubts about the likelihood of achieving the analysts’ expectations for powerful, double-digit growth for the year.
· Guidance. Analysts are expecting U.S. companies to produce about 8% growth in earnings from a year ago in the second quarter, down two percentage points from the start of the year. However, analysts are more aggressively cutting their estimates for companies in Europe and Japan. Overall estimates for the second quarter have been cut by seven to 10 percentage points already—with more cuts likely to come as the earnings season continues in the weeks ahead. Estimates for 2014 are also likely to come down sharply for Europe and Japan from about 17-18%.
The decline in expectations raises questions about the “discount” in valuation, or forward price-to-earnings ratio (measured by the current price per share divided by the expected earnings per share over the next four quarters). Stocks in Europe and Japan currently trade at about a 10% discount to U.S. stocks [Figure 2]. However, if earnings expectations continue to decline, those forward valuations will climb as the price is divided by lower earnings. This may result in a rise in relative valuations that could significantly reduce or even eliminate the “discount” of Europe or Japan to the U.S. market.
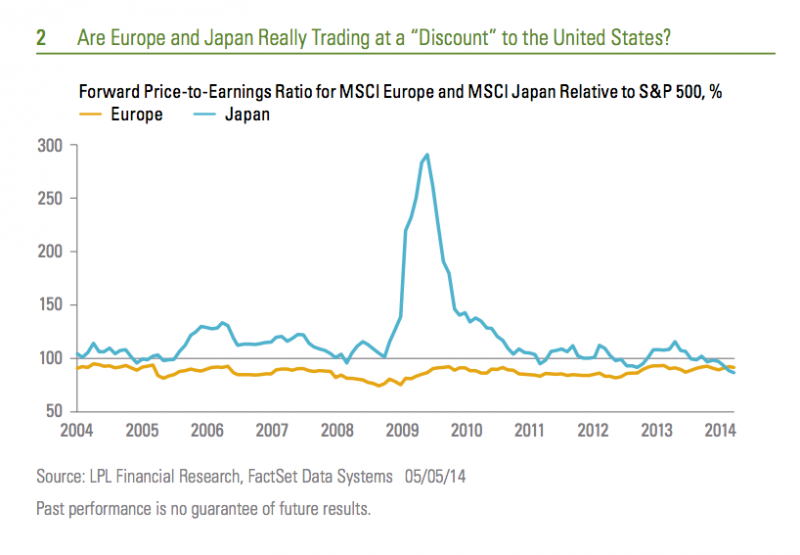
That said, with Japan trading at the biggest discount to the United States in the past 10 years, it appears investors may already have adjusted their expectations for relative earnings growth and are more guarded about future prospects than analysts. However, it is hard to see these regions outperforming the United States on ongoing sharp downward revisions to analyst earnings expectations. We remain convinced that developed foreign stocks will have a hard time outperforming U.S. stocks in 2014, but may not lag dramatically like they did in 2013.
IMPORTANT DISCLOSURES
The opinions voiced in this material are for general information only and are not intended to provide specific advice or recommendations for any individual. To determine which investment(s) may be appropriate for you, consult your financial advisor prior to investing. All performance reference is historical and is no guarantee of future results. All indices are unmanaged and cannot be invested into directly. Past performance is no guarantee of future results.
The economic forecasts set forth in the presentation may not develop as predicted and there can be no guarantee that strategies promoted will be successful.
Stock and mutual fund investing involves risk including loss of principal.
Earnings per share (EPS) is the portion of a company's profit allocated to each outstanding share of common stock. EPS serves as an indicator of a company's profitability. Earnings per share is generally considered to be the single most important variable in determining a share's price. It is also a major component used to calculate the price-to-earnings valuation ratio.
The P/E ratio (price-to-earnings ratio) is a measure of the price paid for a share relative to the annual net income or profit earned by the firm per share. It is a financial ratio used for valuation: a higher P/E ratio means that investors are paying more for each unit of net income, so the stock is more expensive compared to one with lower P/E ratio.
INDEX DESCRIPTIONS
The Standard & Poor’s 500 Index is a capitalization-weighted index of 500 stocks designed to measure performance of the broad domestic economy through changes in the aggregate market value of 500 stocks representing all major industries.
The MSCI Europe Index is a free float-adjusted market capitalization weighted index that is designed to measure the equity market performance of the developed markets in Europe. The MSCI Japan Index is a free-float adjusted market capitalization weighted index that is designed to track the equity market performance of Japanese securities listed on Tokyo Stock Exchange, Osaka Stock Exchange, JASDAQ and Nagoya Stock Exchange.
This research material has been prepared by LPL Financial.
To the extent you are receiving investment advice from a separately registered independent investment advisor, please note that LPL Financial is not an affiliate of and makes no representation with respect to such entity.
Not FDIC or NCUA/NCUSIF Insured | No Bank or Credit Union Guarantee | May Lose Value | Not Guaranteed by any Government Agency | Not a Bank/Credit Union Deposit
Tracking # 1-270089 (Exp. 05/15)


